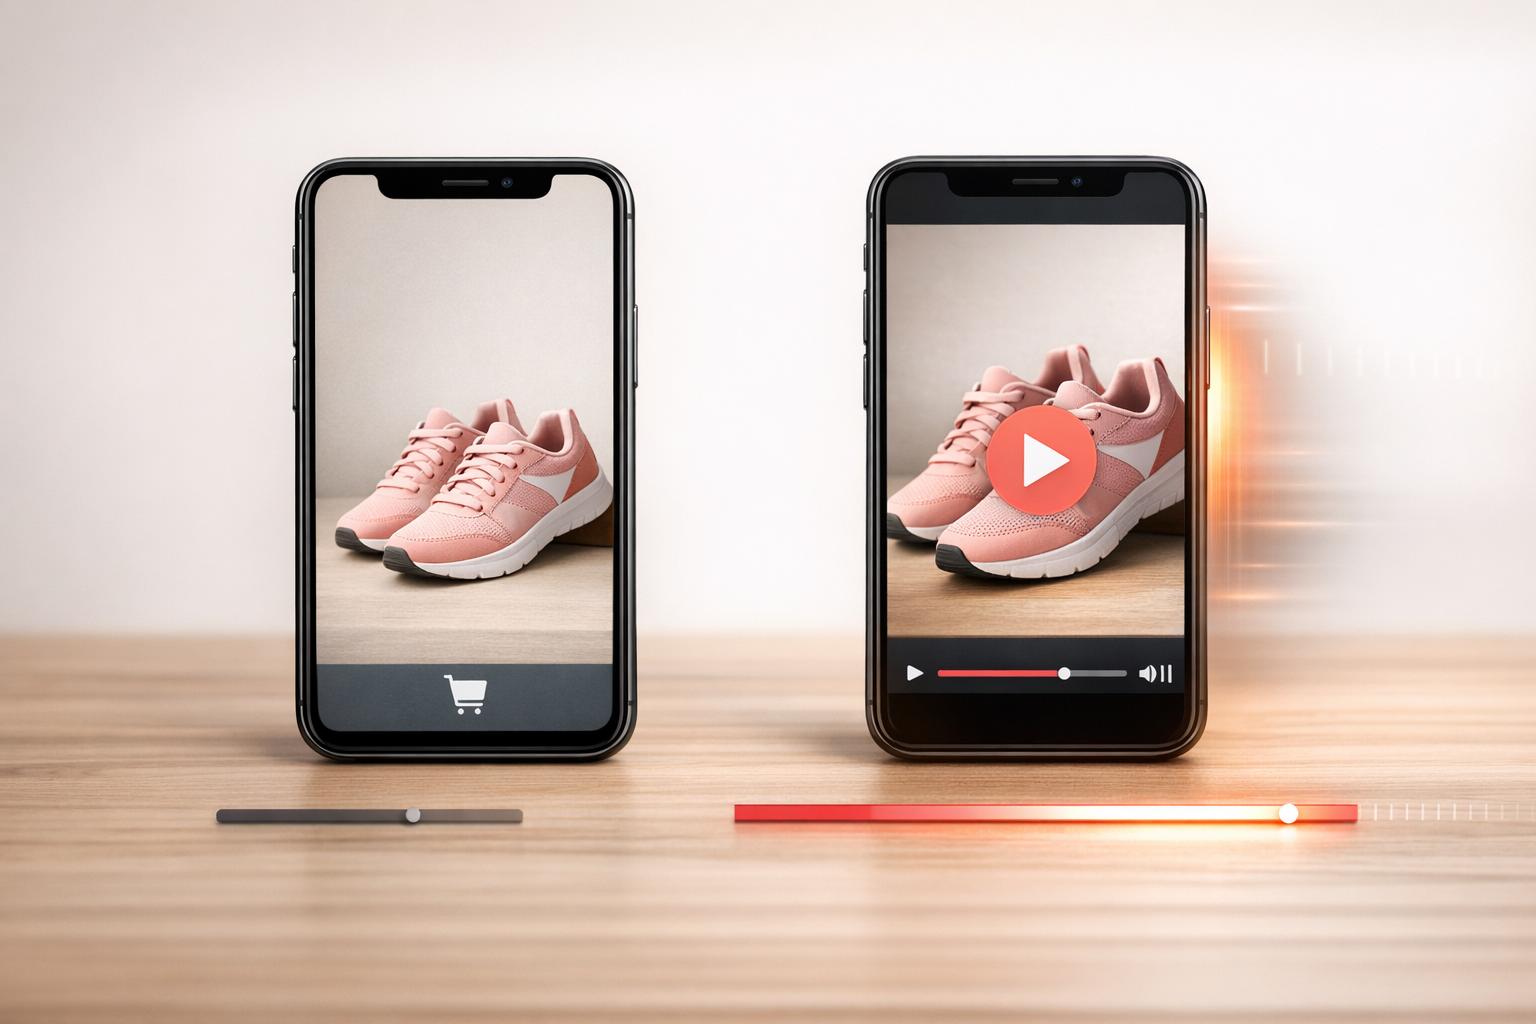
Shoppable videos are transforming online shopping by merging product exploration and purchasing directly within video content. These videos can increase purchase intent by 9x, boost purchase completion by 41%, and extend viewing time by 47% compared to traditional formats. But how do you measure their success?
It comes down to two key metrics:
- Engagement Metrics: Track viewer interactions like watch time, clicks, and shares. These reveal what captures attention and keeps viewers interested.
- Conversion Metrics: Measure actions like purchases, add-to-cart rates, and revenue. These show how effectively interest translates into sales.
For example, brands like Ava Estell achieved a 23% engagement rate and a 21% conversion rate, generating nearly $930,000 in revenue. While engagement shows how well your content connects with viewers, conversions reveal its financial impact. Balancing both is essential for understanding and improving your shoppable video performance.
Here’s how you can track and enhance these metrics on Shopify:
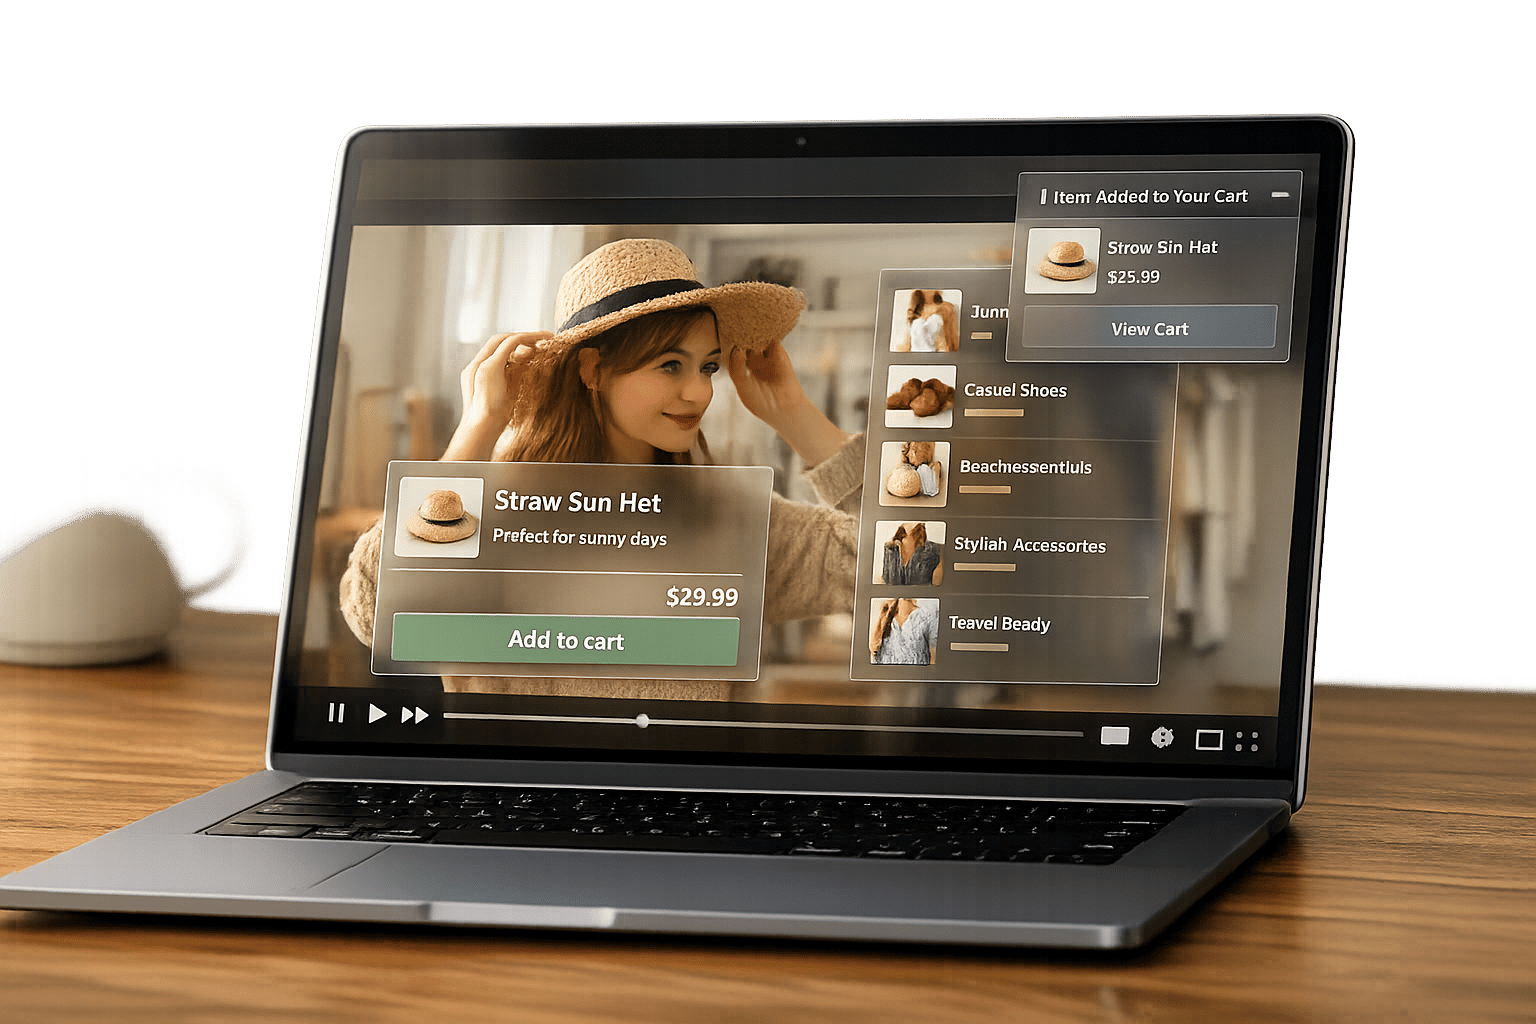
- Use apps like UWidget to embed shoppable videos.
- Focus on clear calls-to-action (CTAs) and seamless checkout experiences.
- Analyze data to optimize content and reduce friction in the sales funnel.
Bottom line: Engagement builds interest, but conversions drive ROI. Both are crucial to maximizing the success of your shoppable video campaigns.
Intro to Video Campaign Metrics
sbb-itb-d9e5b3a
What Are Engagement Metrics?
Engagement metrics are essential for understanding how viewers interact with your shoppable video content. These metrics track both passive behaviors (like watch time) and active ones (such as clicks, likes, shares, and comments). They give you a clear picture of what grabs attention and where viewers lose interest. Plus, high engagement can boost your video’s visibility on platforms like YouTube, which you can use to drive traffic to your store, TikTok, and Instagram by signaling quality to their algorithms, which helps improve search rankings and discoverability.
Key Engagement Metrics
Watch Time
This measures the total time viewers spend watching your videos. Unlike simple view counts - which can be misleading due to brief impressions - watch time reflects genuine interest and content quality.
Average View Duration (AVD)
AVD shows how long, on average, a viewer sticks around before leaving. This varies depending on content type. For example, Instagram Reels and TED Talks often have different AVD benchmarks. It’s a useful way to assess whether your video’s length and content match what your audience expects.
Click-Through Rate (CTR)
CTR tracks the percentage of viewers who click on your video thumbnail, title, or in-video call-to-action. Shoppable videos, in particular, can significantly boost CTR - sometimes by as much as 10 times. This makes CTR a crucial step in driving viewers down your sales funnel.
Engagement Rate
This metric measures the percentage of viewers who actively interact with your content, whether through likes, comments, shares, or clicks on product tags. For example, in 2023, the compression sock brand Apolla used user-generated content to create shoppable tutorials. Their efforts led to a 21.47% engagement rate and generated over $193,800 in revenue. Engagement rate is a strong indicator of how well your content connects with your audience.
Video Completion Rate
Also known as View-Through Rate, this metric shows the percentage of viewers who watch your video all the way through. Short TikTok videos, especially those under 15 seconds, often achieve completion rates over 70%. High completion rates suggest your content resonates with viewers and keeps their attention.
These metrics go beyond just measuring interaction - they provide actionable insights to fine-tune your content for better performance.
Why Engagement Metrics Matter
Engagement metrics reveal how well your content connects with your audience. For instance, when the skincare brand Ava Estell adopted video marketing strategies, they achieved a 23% engagement rate, resulting in nearly $930,000 in additional revenue.
These metrics also offer valuable behavioral data. For example, audience retention graphs can pinpoint where viewers lose interest, allowing you to adjust your content. Adding a "pattern interrupt" - like a sudden visual or audio change - at key moments can help re-engage viewers and reduce drop-offs.
But the benefits don’t stop there. Strong engagement lays the groundwork for building brand awareness and customer loyalty. When viewers interact with and share your content, it leaves a lasting impression. Even if they don’t convert right away, this connection can influence future purchases.
What Are Conversion Metrics?
Conversion metrics track how many viewers take a desired action after watching your shoppable video - whether that’s making a purchase, adding items to their cart, or signing up for a newsletter. Unlike engagement metrics, which measure general interaction, these metrics show how effectively your video turns interest into actual transactions.
These metrics also help differentiate two types of revenue. Direct sales occur when viewers interact with your video and complete a purchase in the same session. Meanwhile, influenced sales happen when viewers watch for more than 5 seconds and buy later in the same session. Both types provide insights into how your videos contribute to revenue generation.
The impact can be impressive. Shoppable videos have been shown to increase conversion rates by up to 80% compared to static content, with 41% of viewers making purchases after watching. This is why conversion metrics go beyond surface-level numbers like views - they offer a clear picture of the financial return from your video efforts. Let’s dive into the key metrics that measure these conversions.
Key Conversion Metrics
Conversion Rate measures the percentage of viewers who make a purchase after watching your video. The formula is:
(Total Conversions / Total Video Views) × 100.
For context, the average conversion rate for static images on Shopify is just 1.4%. Compare that to shoppable videos: Dr. Dennis Gross achieved an 8.2% conversion rate, generating over $1 million in revenue. Similarly, the skincare brand Ava Estell hit a 21% conversion rate, resulting in £743,000 in additional revenue.
Add-to-Cart Rate tracks the percentage of viewers who add products to their cart directly from the video. Use this formula:
(Total Add-to-Carts / Total Video Views) × 100.
This metric highlights high-intent behavior, even if the purchase happens later.
Average Order Value (AOV) reveals whether your video encourages higher spending per transaction. Calculate it by dividing the total revenue from the video by the number of video-related orders.
Revenue Per Click (RPC) measures the revenue generated per interaction with your video. The formula is:
Total Revenue / Total Clicks on Product Tags.
Return on Investment (ROI) is the ultimate measure of your campaign’s success. The formula is:
(Gain from Investment - Cost of Investment) / Cost of Investment.
For example, Dr. Dennis Gross achieved a 328× ROI with his shoppable video campaign, which included $50,000 in direct orders through the video player.
| Metric | Formula | What It Reveals |
|---|---|---|
| Conversion Rate | (Total Conversions / Total Video Views) × 100 | How well the video drives purchases |
| Add-to-Cart Rate | (Total Add-to-Carts / Total Video Views) × 100 | Viewer interest before completing a purchase |
| Average Order Value | Total Revenue / Total Number of Orders | Whether the video leads to higher-value purchases |
| Revenue Per Click | Total Revenue / Total Clicks on Product Tags | The monetary value of each interaction |
| Return on Investment | (Gain - Cost) / Cost | Overall financial success of the campaign |
These metrics go beyond just tracking interest - they show how effectively your shoppable videos turn curiosity into revenue.
Why Conversion Metrics Matter
Conversion metrics offer the clearest insight into the financial impact of your shoppable videos. While engagement metrics help you understand what grabs attention, conversion metrics reveal whether that attention leads to actual sales - a critical factor when allocating marketing budgets or deciding which campaigns to scale.
"Understanding the return on investment (ROI) of your shoppable videos helps you see the financial impact of your efforts. By measuring ROI, you can determine whether the money spent on creating and promoting these videos translates into actual sales."
– Ritesh Kewlani, Head of Product Marketing, Firework
They also help pinpoint issues in your sales funnel. For instance, if your video has a strong click-through rate but a low conversion rate, it might signal a disconnect between the video and the landing page experience. Additionally, comparing direct and influenced sales can help you understand whether your video is better at driving immediate purchases or supporting a longer customer journey.
Take Apolla, for example. After appearing on Shark Tank, the brand turned user-generated content into shoppable tutorials, achieving a 9.94% conversion rate and generating over $193,800 in revenue. This shows how well-designed videos can not only engage viewers but also drive them to take action.
Engagement vs. Conversion Metrics: Side-by-Side Comparison
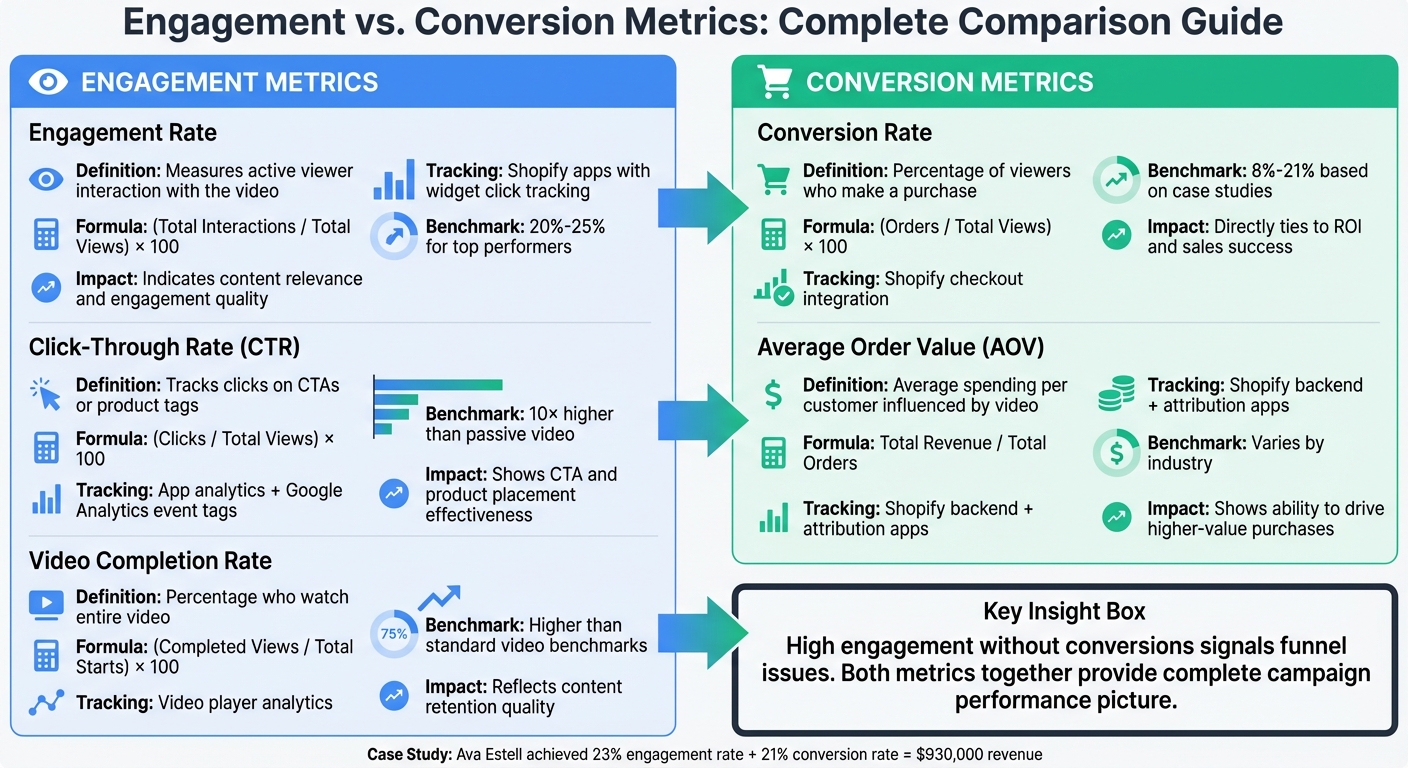
Engagement vs Conversion Metrics for Shoppable Videos: Key Differences and Benchmarks
Engagement and conversion metrics each bring something distinct to the table when evaluating shoppable video performance. Engagement metrics tell you how well your content grabs attention and holds it - essentially acting as an early indicator of interest. Conversion metrics, on the other hand, measure whether that interest turns into actual sales or revenue. When engagement is high, but conversions lag, it’s often a sign of issues like checkout friction or a mismatch between your video content and the landing page. Higher engagement tends to align with better conversion rates, as discussed earlier, but monitoring both metrics is essential for a comprehensive view of your campaign's impact.
Together, these metrics give you a detailed map of what’s working and what’s not. Below is a quick comparison to help you understand their roles:
Direct Comparison of Metrics
| Metric | Definition | Calculation Formula | Shopify Tracking Method | Typical Benchmarks | Impact on Success |
|---|---|---|---|---|---|
| Engagement Rate | Measures active viewer interaction with the video | (Total Interactions / Total Views) × 100 | Shopify apps with widget click tracking | 20%–25% for top performers | Indicates how engaging and relevant your content is |
| Click-Through Rate (CTR) | Tracks how many viewers click on CTAs or product tags | (Clicks / Total Views) × 100 | App analytics + Google Analytics event tags | 10× higher than passive video | Shows the effectiveness of CTAs and product placement |
| Conversion Rate | Percentage of viewers who make a purchase | (Orders / Total Views) × 100 | Shopify checkout integration | 8%–21% based on case studies | Directly ties to ROI and sales success |
| Video Completion Rate | Percentage of viewers who watch the entire video | (Completed Views / Total Starts) × 100 | Video player analytics | Higher than standard video benchmarks | Reflects how well your content retains viewers |
| Average Order Value (AOV) | Average spending per customer influenced by the video | Total Revenue / Total Orders | Shopify backend + attribution apps | Varies by industry | Highlights the video's ability to drive higher-value purchases |
If you notice a drop in completion rates or a gap between CTR and conversions, it’s time to dig deeper. For example, if viewers stop watching at a particular point in the video, consider restructuring your content. If CTR is strong but conversions fall short, examine your checkout process and landing page to minimize friction. Small adjustments in these areas can make a big difference.
Why Conversions Matter More for ROI
Conversions are the backbone of ROI when it comes to marketing. While metrics like views, likes, and shares can show that people are engaging with your content, they don't reveal whether those interactions are translating into purchases. ROI, at its core, is a financial calculation - your gain or loss divided by the original investment. This means that only sales-driven metrics can determine whether your shoppable video campaign is actually profitable. These numbers provide the clearest picture of the financial impact of your efforts.
Take 2023 as an example: brands like Dr. Dennis Gross and Apolla saw conversion rates of 8.2% and 9.94%, respectively, generating over $1 million and $193,800 in revenue. This underscores the fact that while views may indicate interest, they don’t necessarily lead to profit.
High engagement without conversions should raise a red flag, not spark celebration. If your videos are getting plenty of views but few sales, it’s a sign that something in your sales funnel isn’t working. For instance, if viewers aren’t clicking your calls-to-action (CTAs), the issue could be poor placement or timing. If they are clicking but not purchasing, you might be dealing with checkout friction or a disconnect between your video’s promise and the landing page experience. Beauty brand Ava Estell addressed this exact issue and saw a 23% engagement rate paired with a 21% conversion rate, resulting in $743,000 in additional revenue. Engagement metrics may show interest, but only conversions can justify your marketing spend.
It’s also worth noting that engagement metrics can be misleading. Different platforms define a "view" differently - Facebook counts a view after 3 seconds, while YouTube waits until 30 seconds - making it difficult to compare performance across platforms. As Tolstoy aptly said:
"Although views, likes, and shares are important metrics to consider for social video content, sales truly matter in the long term".
After all, likes don’t pay the bills.
If maximizing ROI is your goal, use a Shopify conversion rate calculator and focus on tracking which products convert through your videos. Start by zeroing in on the top 20% of products that generate 80% of your revenue for quicker returns. And here’s a key insight: products showcased in videos convert 86% better than those with static images alone. Plus, customers engaging with product videos tend to spend 30% more on average.
How to Track and Improve Both Metrics on Shopify
Tracking Engagement and Conversion Metrics on Shopify
Shopify offers built-in tools to help you connect your product catalog with platforms like YouTube and TikTok. This integration allows you to tag products in livestreams and manage sales directly from your Shopify dashboard. However, these native tools fall short when it comes to tracking video-specific metrics, such as influenced revenue or session time added by video content. As Liana Turbureanu from Videowise points out:
"Traditional tools used to host and manage the videos on a Shopify website cannot track essential video engagement and conversion metrics."
It’s crucial to distinguish between direct sales (purchases made within the video player) and influenced sales (purchases made after a viewer watches at least 5 seconds of a video). Specialized apps can help by providing conversion funnel dashboards that map out the journey from video view to purchase. When analyzing video performance, focus on watch time rather than raw view counts, as the definition of a "view" can vary widely across platforms. Moving from Shopify’s native tools to specialized apps ensures you capture a complete picture of your video's impact.
Using Shopify Apps to Improve Metrics
Shopify apps can help bridge the gap between video engagement and conversion tracking, creating a smoother path from viewer interest to purchase. For instance, apps designed for shoppable video content can boost both engagement and sales. Take UWidget, which lets you embed shoppable YouTube videos and Shorts into your storefront using carousels, grids, or sticky players - all without slowing down your site. UWidget’s flexibility makes it a great option, with one managing director reporting that their video setup added an average of 26.5 seconds of extra time on site per visitor.
To make the checkout process smoother, consider pairing video tools with apps like CheckIt. CheckIt introduces a progress bar to guide customers through the purchasing steps, reducing friction along the way. For boosting engagement and gauging customer interest, ILikeThat adds "like" buttons to your product pages, signaling purchase intent and building brand loyalty. By integrating clickable product tags and clear calls-to-action (CTAs) directly into your videos, you can create a seamless journey from discovery to purchase.
Fine-tuning your CTA placements can also make a big difference. Experiment with different locations for your CTAs to see what works best. For example, CTAs placed in the bottom-right corner tend to perform 15% better than those in the center. Additionally, inserting product tags within the first 15 seconds of a video can help capture the audience’s attention when engagement is at its peak. If your videos are getting plenty of views but click-through rates are lagging, it might be time to tweak your CTA visibility or adjust your landing page to better align with the video’s message.
Conclusion
In shoppable videos, engagement metrics and conversion metrics aren't at odds - they complement each other. Metrics like view-through rate and time spent watching show how well your content connects with viewers and builds trust. On the other hand, conversion metrics such as click-through rate and return on ad spend reveal the financial impact. Together, they paint a full picture of your video's success, showing both how and why it performed as it did.
Shoppable videos are powerful tools for increasing purchase intent and delivering measurable outcomes. For instance, high engagement - especially when viewers interact with features like polls or product tags - often translates to higher conversion rates. If engagement is high but conversions lag, it could point to issues like a clunky landing page or pricing concerns. Conversely, low engagement paired with strong conversions might suggest your content isn't reaching enough people.
Case studies show that well-optimized shoppable videos can drive conversion rates between 8% and 21%, leading to noticeable revenue growth. These examples highlight the importance of monitoring every step of the customer journey - from the first few seconds of video watch time to the final purchase.
For Shopify store owners, the key is to regularly analyze performance data and experiment with A/B testing. Test things like where you place your call-to-action (CTA) buttons or the timing of product tags to see what drives better results. Also, track "influenced revenue" - purchases made later in the session after viewers spent at least five seconds engaging with your video. Tools like UWidget, ILikeThat, and CheckIt can help fine-tune both engagement and conversion metrics.
Engagement fosters a connection, while conversions validate your video's impact. Businesses that dig into advanced analytics often see 20–30% better results from their shoppable video efforts. Striking a balance between these metrics is the key to driving consistent growth and maximizing your return on investment.
FAQs
How do I balance engagement and conversions when evaluating shoppable video success?
Balancing engagement and conversion metrics in shoppable videos comes down to aligning your content strategy with specific goals. Engagement metrics - like watch time, audience retention, and interaction rates - reveal how well your video grabs attention and connects with viewers. These are crucial for building awareness and sparking interest in your brand.
On the other hand, conversion metrics, such as click-through rates and sales figures, show how effectively your video turns that interest into action. To strike the right balance, focus on crafting engaging content that naturally encourages conversions. For instance, adding interactive elements like product tags or in-video checkout options can keep viewers engaged while making shopping effortless.
Consistently reviewing both engagement and conversion data is key to improving your strategy. By identifying what captures your audience’s attention and what drives them to purchase, you can create shoppable videos that excel at both connecting with viewers and delivering results.
How can I boost conversion rates for shoppable videos on Shopify?
To drive more conversions with shoppable videos on Shopify, focus on crafting engaging, high-quality content. Showcase your product's benefits in a way that grabs attention, and include clear, compelling calls-to-action (CTAs) to guide viewers toward making a purchase.
Incorporating interactive elements like clickable product tags or overlays is another game-changer. These features let viewers shop directly from the video, removing unnecessary steps and making the buying process smoother.
Don't overlook the importance of speed. Ensure your videos load quickly by compressing files, using reliable hosting services, and enabling lazy loading. Faster load times improve user experience, reduce bounce rates, and keep potential customers watching longer.
Finally, use analytics tools to monitor key metrics such as watch time and click-through rates. This data will help you tweak your content and fine-tune your strategy for better results. By combining visually appealing content, interactive features, and technical efficiency, you can turn shoppable videos into a powerful conversion tool.
Why doesn’t high engagement always result in more conversions for shoppable videos?
High engagement in shoppable videos - measured by likes, comments, or shares - shows that viewers are interested and interacting with the content. However, this doesn’t always mean they’ll make a purchase. People might enjoy the video or browse the products without committing to buy. Things like price, trust in the brand, or even timing can play a big role in whether that interest turns into a sale.
While engagement helps boost awareness and spark curiosity, it’s equally important to keep an eye on conversion metrics. These numbers give a clearer picture of how well your shoppable videos are driving actual sales.