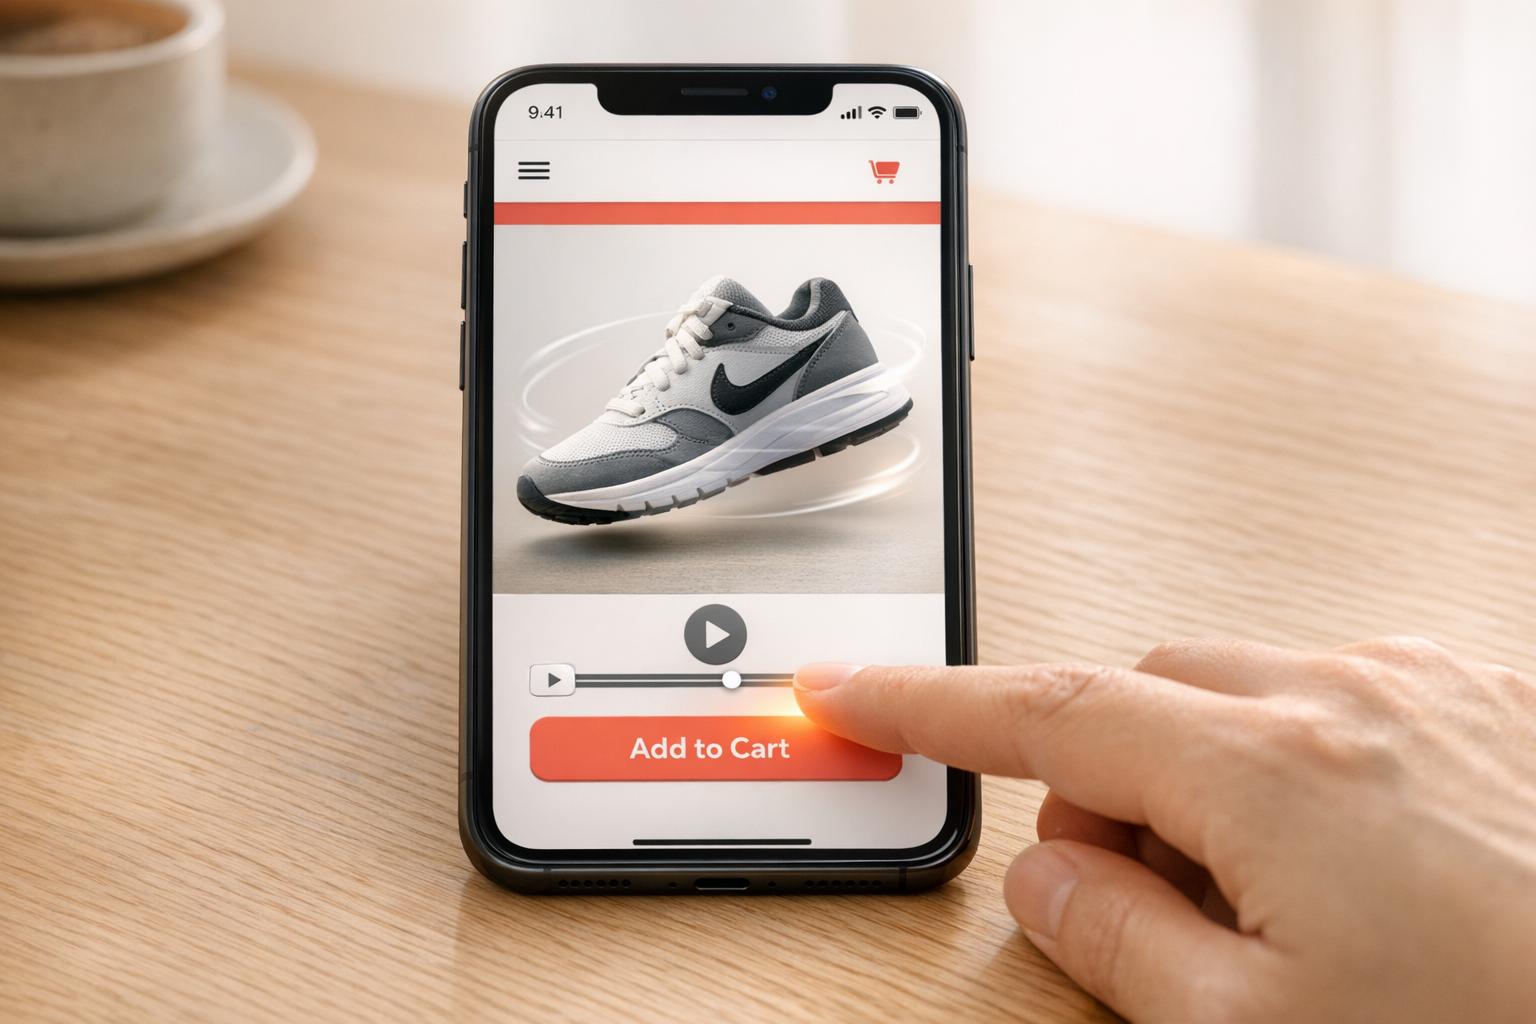
Shoppable videos let viewers shop directly within video content by clicking on product tags or adding items to their cart. To measure their success, focus on these key metrics:
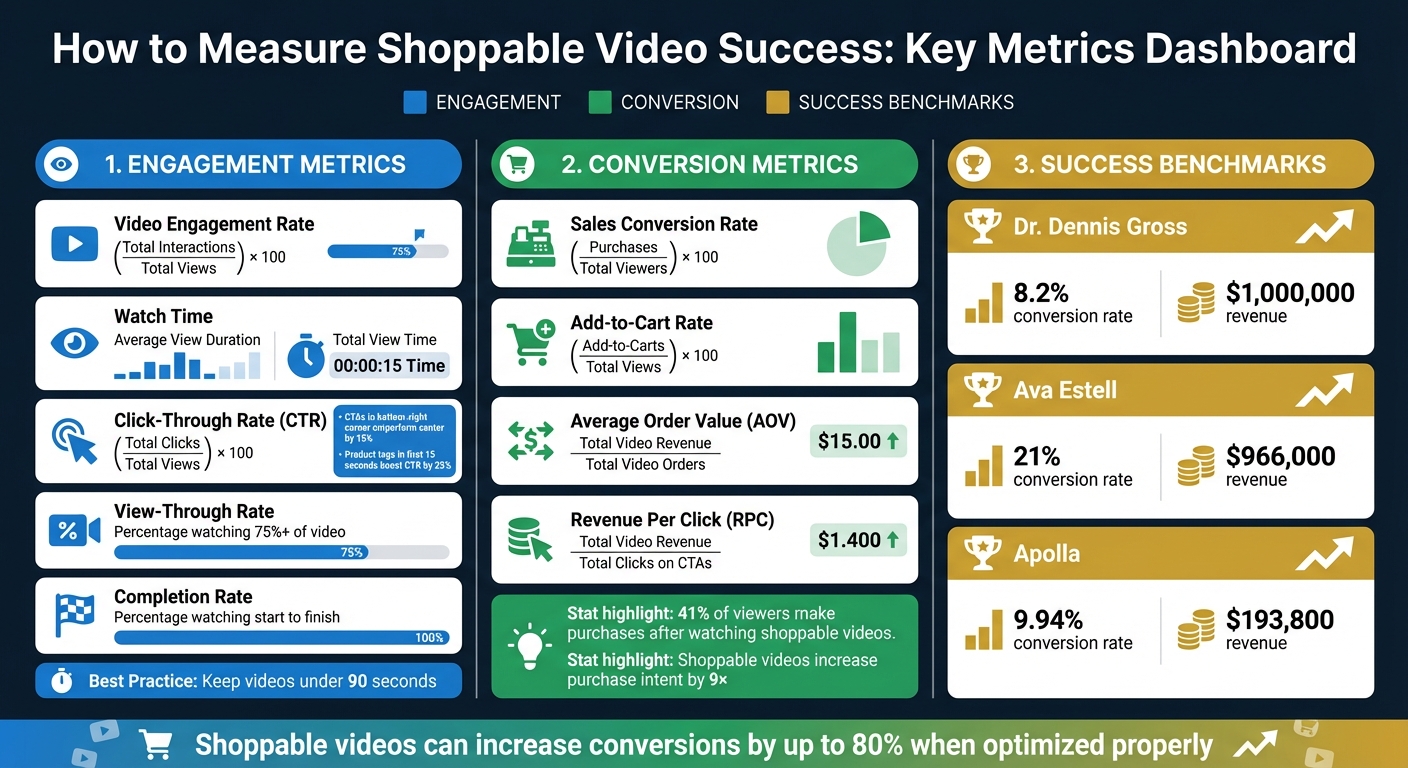
- Engagement Metrics: Track video engagement rate, watch time, view-through rate, and completion rate to see how viewers interact and stay engaged.
- Conversion Metrics: Monitor click-through rates (CTR) on product tags, sales conversion rates, and add-to-cart rates to gauge purchasing behavior.
- Financial Metrics: Analyze average order value (AOV), revenue per click (RPC), and influenced revenue to assess the impact on sales.
Tools like Shopify Analytics, Google Analytics 4, and UWidget can help track and analyze these metrics effectively. Start by defining clear KPIs, comparing results across video types and placements, and refining your strategy based on data. Shoppable videos can increase conversions by up to 80% when optimized properly.
Key Metrics for Measuring Shoppable Video Success
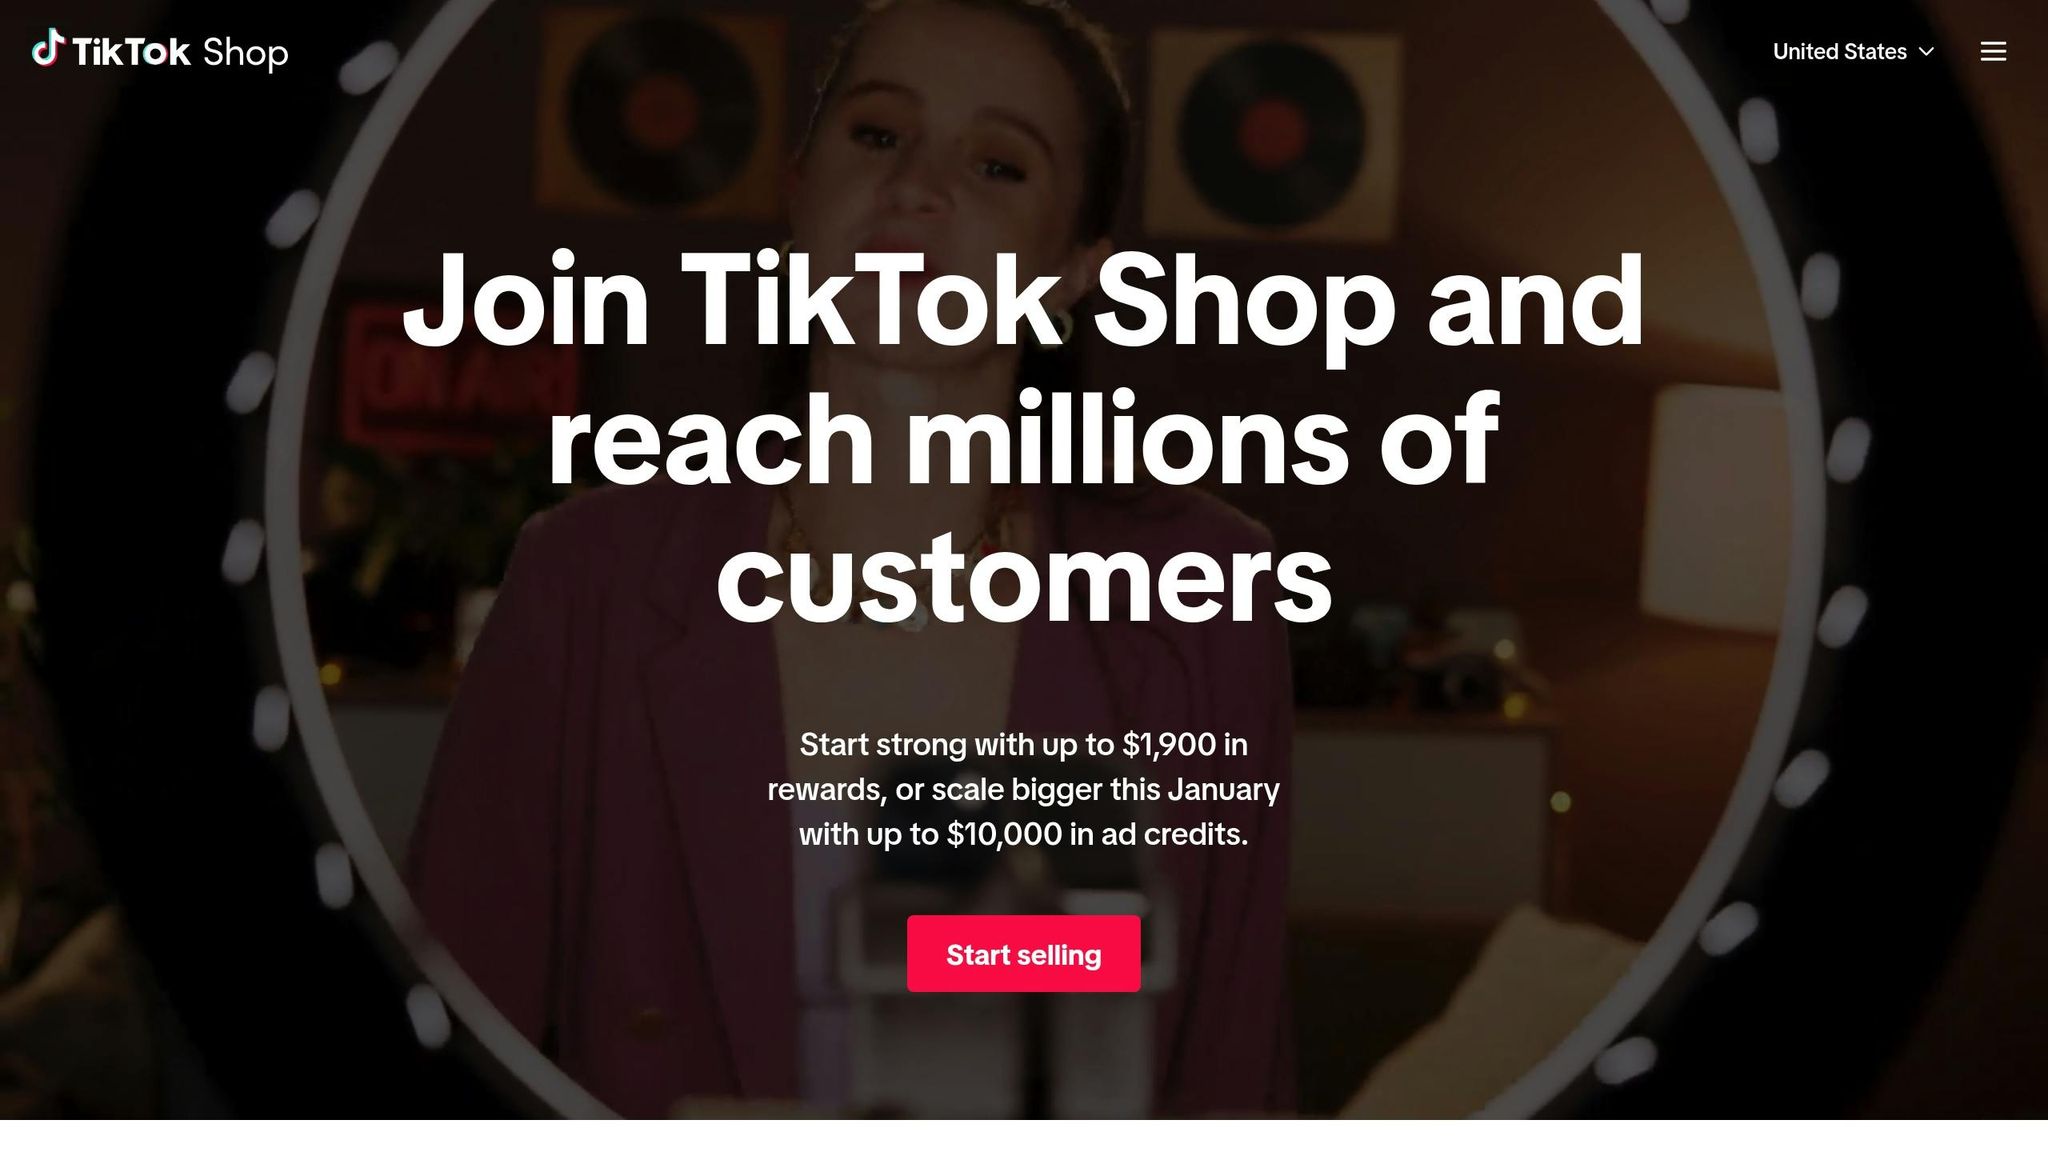
TikTok Shop Analytics Explained: Track Best-Selling Products
Engagement Metrics to Monitor
Tracking engagement metrics is essential for improving the performance of shoppable videos. These metrics reveal how viewers interact with your content, showing whether it captures attention and drives action - two key factors for boosting conversions.
Video Engagement Rate and Watch Time
Engagement rate measures viewer interactions like likes, shares, comments, and clicks on product tags. To calculate it, divide total interactions by total views, then multiply by 100.
Watch time, which includes metrics like the average view duration and total view time, reflects how well your content holds attention. Videos with high engagement rates often lead to better conversion rates and stronger brand loyalty.
Since viewer attention is highest in the first 15 seconds, a significant drop in average duration during this window suggests the need for a more compelling opening. Keeping videos under 90 seconds can also help maintain higher completion rates.
Next, consider how effectively product tags turn viewer interest into actionable clicks.
Click-Through Rate on Product Tags
Click-through rate (CTR) shows the percentage of viewers who click on product tags or calls-to-action (CTAs) compared to total views. This metric reveals how persuasive your interactive elements are in driving purchases.
If your video gets plenty of views but has a low CTR, it might mean your product tags are poorly timed, placed, or designed. For example, A/B testing found that placing CTAs in the bottom-right corner outperformed center placements by 15%. Positioning product tags within the first 15 seconds, when attention is at its peak, can boost CTR by 25%.
To calculate CTR, divide total clicks on tags or CTAs by total video views, then multiply by 100. Personalizing CTAs can make a big difference - tailored messaging performs 202% better than generic calls-to-action.
Finally, examine how viewer engagement translates into full video views.
View-Through Rate and Completion Rate
View-through rate (VTR) measures the percentage of viewers who watch at least 75% or more of your video, while completion rate tracks the number of viewers who watch from start to finish. Both metrics are indicators of content quality - higher rates suggest that your video is engaging and holds attention effectively.
If you notice viewers dropping off at specific points, use this data to pinpoint where your content might be losing their interest and adjust your narrative accordingly.
High completion rates are linked to better brand recall and stronger purchase intent since viewers absorb more of your message. Adding interactive features like polls or clickable tags can keep viewers engaged longer, helping to improve both VTR and completion rates.
Conversion and Sales Metrics
Engagement metrics are great for understanding viewer interactions, but conversion and sales metrics take it a step further by showing how shoppable videos contribute directly to your revenue. These numbers connect your video efforts to actual sales, giving a clear picture of their financial impact.
Sales Conversion Rate from Videos
One of the most revealing metrics for shoppable video performance is the sales conversion rate. To calculate it, divide the number of completed purchases by the total number of video viewers, then multiply by 100. This percentage highlights how well your videos are turning viewers into buyers and can also pinpoint where customers might drop off during their shopping journey.
It's important to distinguish between direct sales and influenced sales for accurate tracking. Direct sales happen when a customer adds a product to their cart through the video and completes the purchase in the same session. Influenced sales, on the other hand, occur when viewers watch at least 5 seconds of a video and later make a purchase during the same session.
Here are some real-world examples of shoppable video success:
- Dr. Dennis Gross achieved an 8.2% conversion rate, generating $1,000,000 in revenue.
- Ava Estell saw a 21% conversion rate, bringing in about $966,000 in additional revenue.
- Apolla, after appearing on Shark Tank, used tutorials to reach a 9.94% conversion rate and earned over $193,800 in revenue.
If your videos have high click-through rates but low conversions, the issue might not be the video itself. Instead, check the mobile landing page experience or checkout process. Ensuring a smooth transition from video to purchase is especially critical on mobile devices, where most viewers engage with videos.
Next, let’s dive into metrics like add-to-cart rate and average order value to better understand purchase intent.
Add-to-Cart Rate and Average Order Value
The add-to-cart rate is a strong indicator of purchase intent. It’s calculated by dividing the number of viewers who add items to their cart by the total video views, then multiplying by 100. If this rate is high, your video is successfully nudging viewers toward a buying decision.
Another key metric is average order value (AOV), which measures how much customers spend on average after watching your videos. To find this, divide the total revenue from video-driven purchases by the number of orders placed. A higher AOV suggests your videos are effectively encouraging viewers to buy more expensive products, add complementary items, or take advantage of bundles.
For a deeper look at financial impact, track revenue per click (RPC). This is calculated by dividing the total revenue from videos by the total clicks on calls-to-action (CTAs) or product tags. If engagement is high but RPC is low, consider re-evaluating your product pricing or bundling strategies.
| Metric | Formula | What It Measures |
|---|---|---|
| Sales Conversion Rate | (Purchases / Total Viewers) × 100 | How well videos drive direct sales |
| Add-to-Cart Rate | (Add-to-Carts / Total Views) × 100 | Viewer intent to purchase |
| Average Order Value | Total Video Revenue / Total Video Orders | Spending behavior per customer |
| Revenue Per Click | Total Video Revenue / Total Clicks on CTAs | Financial return on viewer interactions |
Influenced Revenue and Orders
Influenced revenue measures the total sales linked to your video content, even if the purchases aren’t made directly through the video. To ensure meaningful attribution, set a viewing threshold - typically 5 seconds. This recognizes that videos often serve as discovery tools, sparking interest that leads to purchases later.
In addition to revenue, track the number of influenced orders to gauge how your videos contribute to overall store performance. Monitoring the number of unique influenced shoppers can reveal how video content impacts your total gross merchandise value.
To fine-tune your strategy, use UTM parameters to create unique tracking links for different video placements, such as product pages or the homepage. This can help you identify which placements drive the most influenced revenue. Data shows that 41% of viewers make purchases after watching a shoppable video, and shoppable videos can increase purchase intent by up to 9×.
"Shoppable videos offer an immersive experience for shoppers as they get to watch product demonstrations while being able to make purchases without leaving the page or having to search through complex menus." - Jamie Irwin, Director & Founder, Straight Up Search
These insights set the stage for leveraging advanced tracking tools on platforms like Shopify to refine and maximize your video content’s impact.
sbb-itb-d9e5b3a
Tools for Tracking Performance on Shopify

Once you’ve pinpointed the metrics that matter, the next step is finding the right tools to track them. Shopify’s built-in analytics, along with specialized platforms, provides a range of insights - from monitoring real-time traffic to understanding user behavior. Here’s a closer look at these tools.
Shopify Analytics Integration
Shopify's built-in analytics offers a central dashboard where you can track recent activity, assess web performance, and monitor sales trends. One of its standout features is the customizable metric cards, which summarize key data points. For instance, if you launch a new shoppable video campaign, this tool can help you measure engagement spikes as they happen. Since Shopify Analytics comes included with any subscription plan, there’s no extra cost to start analyzing video-driven sales.
Google Analytics for Video Insights
Google Analytics 4 (GA4) integrates with Shopify using the official Google & YouTube channel app. This setup allows you to track critical data like user acquisition, audience demographics, device usage, and traffic sources for pages featuring embedded videos. The real-time reporting feature is particularly useful - upload a video or promote it, and you can immediately monitor viral spikes and engage with new viewers while their interest is fresh.
"Data is a gift you shouldn't ignore. Otherwise, you're shooting in the dark every time, unaware of whether you're getting closer to or further away from your target" - Michael Keenan, Shopify
GA4 is free to use and provides a broader range of behavioral data compared to Shopify’s more transaction-focused analytics.
UWidget for Video Widgets and Analytics
For those embedding YouTube videos directly on their Shopify store, UWidget is an excellent choice. This app creates shoppable video experiences by letting you tag products directly in video galleries, carousels, or sticky players. Customers can shop without ever leaving the video. UWidget’s Insights & Metrics section helps you analyze engagement, making it easier to identify which video formats deliver the best results. The app also supports various layouts, including sticky video players that stay visible as users scroll, and uses a thumbnail-first, lazy-loading approach to maintain fast page loading speeds. Pricing starts at $5.99 per month, and it has earned a perfect 5.0-star rating on the Shopify App Store.
"I am pleased with this app. It allows shorts and videos to be displayed and easily integrated on my e-commerce store" - Merchant from Wholesale Nursery Co
These tools give you the insights needed to fine-tune your strategy, setting the stage for the next step: setting up tracking and analyzing results.
| Tool | Primary Function | Key Metrics Tracked | Cost |
|---|---|---|---|
| Shopify Analytics | General store performance | Net sales by channel, sessions by device, top landing pages | Included with subscription |
| Google Analytics 4 | User behavior & discovery | Traffic sources, audience demographics, session duration | Free |
| UWidget | YouTube widget management | Video engagement, product tag interactions | Starting at $5.99/month |
How to Set Up Tracking and Analyze Results
Once you've chosen your tracking tools, the next step is to define success metrics and organize your data. This will help you spot trends and refine your strategies.
Define KPIs and Benchmarks
Start by categorizing your KPIs into three main areas: engagement, conversion, and financial performance. This helps you determine how effectively your views are turning into revenue. Take Apolla, for example - a compression sock brand featured on Shark Tank. They transformed user-generated content into shoppable tutorials, achieving an impressive 21.47% video engagement rate, a 9.94% conversion rate, and over $193,800 in revenue.
When setting benchmarks, it's essential to differentiate between direct sales (purchases made immediately after interacting with the video) and influenced sales (purchases made later, after watching the video but without using its checkout button). For example, if your baseline conversion rate is 2%, compare that to the potential boost from shoppable videos, which can increase conversions by up to 80%.
It's also helpful to segment your benchmarks by video type (e.g., tutorials vs. testimonials) and placement (e.g., homepage vs. product page). For instance, a tutorial on a product page might naturally convert better than a testimonial on your homepage. Comparing these directly could lead to misleading conclusions. If you notice high views but a low click-through rate, your call-to-action placement might need improvement. On the other hand, a high click-through rate but low conversions could indicate that your landing page isn't delivering on the video's promise.
By organizing your benchmarks this way, you'll set the stage for clearer and more actionable insights.
Use Tables to Compare Metrics Across Videos
Once you've established benchmarks, use tables to compare performance across your video library. This makes it easier to spot top-performing videos and understand what works best in different contexts. For example, Dr. Dennis Gross tracked shoppable video performance and achieved an 8.2% conversion rate, generating $1 million in revenue. By analyzing metrics across various dimensions, you can replicate successes and refine underperforming areas.
| Comparison Dimension | Purpose |
|---|---|
| By Video Type | Identify which formats - tutorials, product demos, or testimonials - perform best. |
| By Placement | Determine which locations, like the homepage, social media, or email campaigns, drive the most conversions. |
| By Device | Compare mobile and desktop performance to optimize the user experience. |
You can also monitor trends over time using line charts to identify seasonal shifts or changes in viewer behavior. If you're embedding YouTube videos with UWidget, its Insights & Metrics feature can help you track engagement across different video formats. This kind of detailed tracking ensures you're always improving and adapting to what your audience responds to most.
Conclusion
By focusing on the right metrics and tools, you can develop a clear, actionable strategy for improving performance. Key areas to monitor include engagement metrics like view-through rates and watch time, conversion metrics such as click-through and add-to-cart rates, and financial metrics like ROAS (Return on Ad Spend) and average order value. Shoppable videos, for instance, can increase conversion rates by up to 80% and significantly boost click-through rates.
To make the most of these insights, leverage analytics tools that connect video performance to revenue. Shopify Analytics integrates seamlessly with your store's sales data, offering a direct view of how videos impact purchases. Google Analytics provides a broader perspective on the customer journey, while UWidget is particularly useful if you're embedding YouTube videos, offering built-in tools to track engagement across formats. These platforms help you pinpoint what resonates with your audience.
Regularly analyzing performance across video type, placement, and device can uncover patterns that lead to better results. For example, you might find that tweaking your call-to-action placement, shortening videos to reduce drop-offs, or doubling down on high-performing formats yields better outcomes.
Establish clear benchmarks, track sales consistently, and use tables to compare video performance. These actionable insights will help you refine your strategy and achieve stronger ROI over time.
FAQs
How can I boost the click-through rate on product tags in shoppable videos?
To increase the click-through rate on product tags in shoppable videos, focus on making them as engaging and relevant as possible for viewers. Start by creating clear, descriptive tags that directly match what your audience is interested in. Timing is key - place the tags at moments when the product is being showcased or used in the video to make them more noticeable and enticing.
Make sure the tags stand out visually. Use overlays or design elements that naturally catch the viewer's eye and make interaction effortless. Don’t forget to track performance data regularly. This will help you identify which tags are working and allow you to fine-tune your strategy. By consistently improving tag placement and relevance, you can drive more engagement with your shoppable videos.
What are the best ways to track the performance of shoppable videos?
To understand how well your shoppable videos are performing, focus on metrics that reveal both engagement and sales impact. Key indicators to monitor include video-influenced orders, session duration, and conversion rates. These numbers help you see how effectively your videos encourage purchases and keep viewers engaged.
Engagement metrics such as views, likes, and comments also shed light on how your audience interacts with your content.
For tracking, platforms like Shopify’s analytics and YouTube’s built-in metrics are great starting points. They provide data on audience demographics, watch time, and engagement patterns. If you want more customization, apps like UWidget allow you to create interactive YouTube widgets, adding extra tracking capabilities. By combining these tools and metrics, you can get a well-rounded picture of how your shoppable videos are driving results for your store.
How do shoppable videos boost sales and improve conversion rates?
Shoppable videos make it easier for viewers to buy products directly while watching, streamlining the shopping process. This approach not only boosts engagement but also removes barriers that might otherwise slow down purchasing decisions.
To gauge their effectiveness, keep an eye on metrics like click-through rates (CTR), conversion rates, and average order value (AOV). These numbers provide a clear picture of how well your videos are encouraging customer actions and driving revenue.