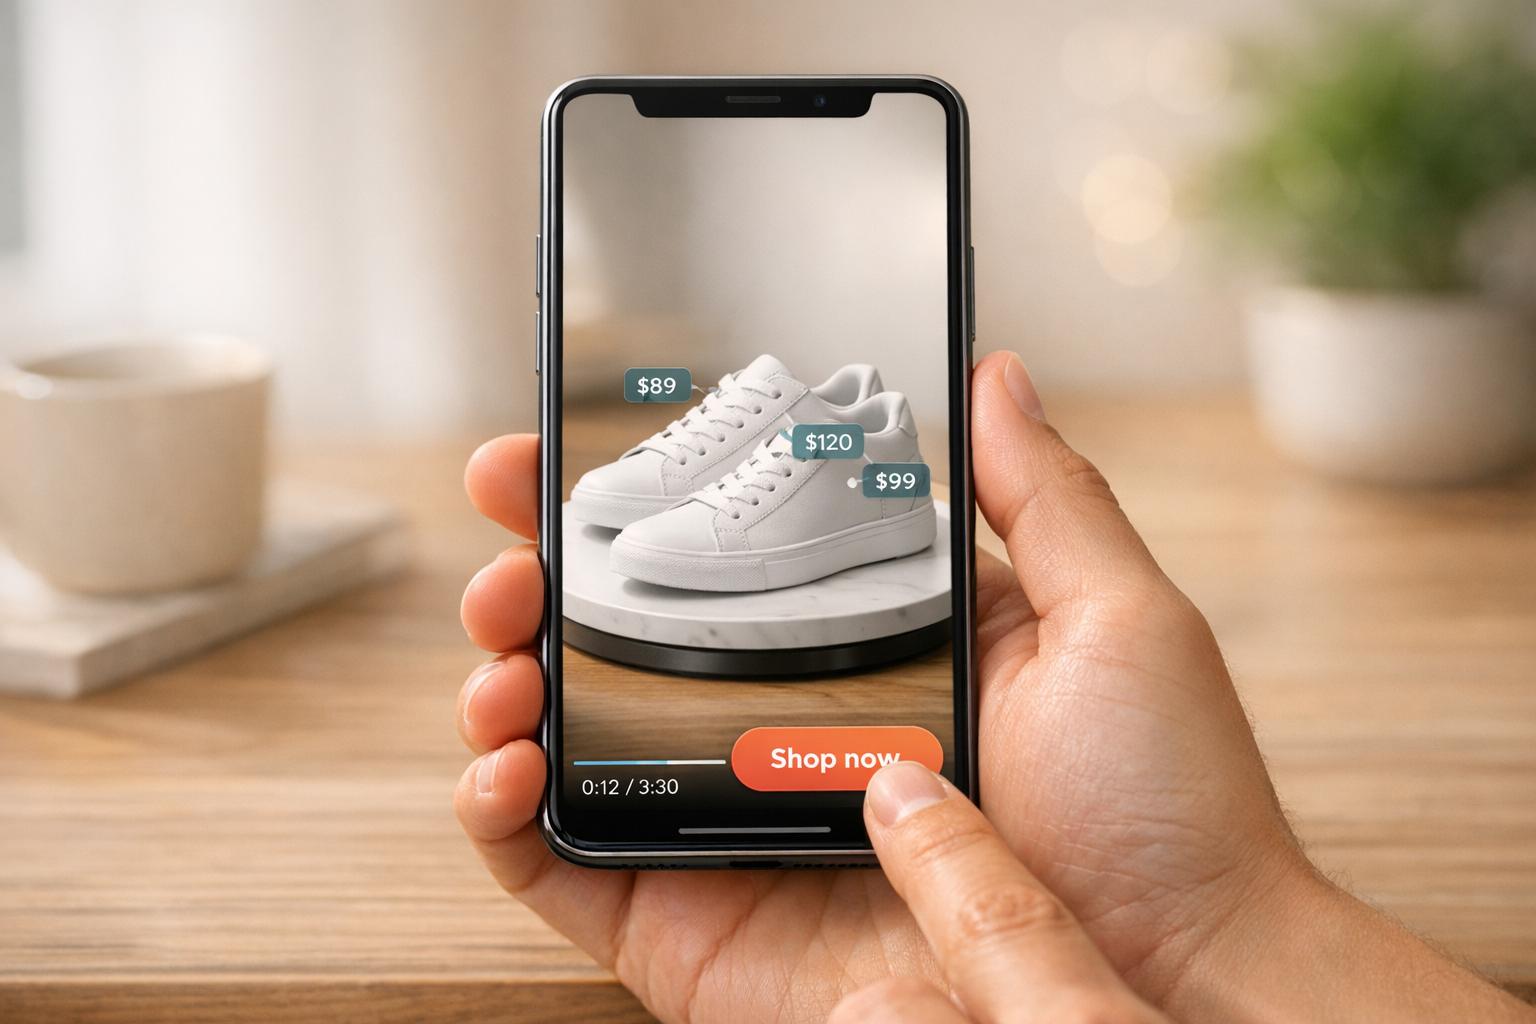
Video commerce is transforming how Shopify stores sell products by enabling customers to shop directly from videos. This approach allows for instant purchases through embedded links or "add to cart" buttons, removing delays between product discovery and checkout. With 82% of consumers influenced to buy after watching a video and 84% of marketers reporting increased sales due to video, the potential is clear.
Key insights from the guide:
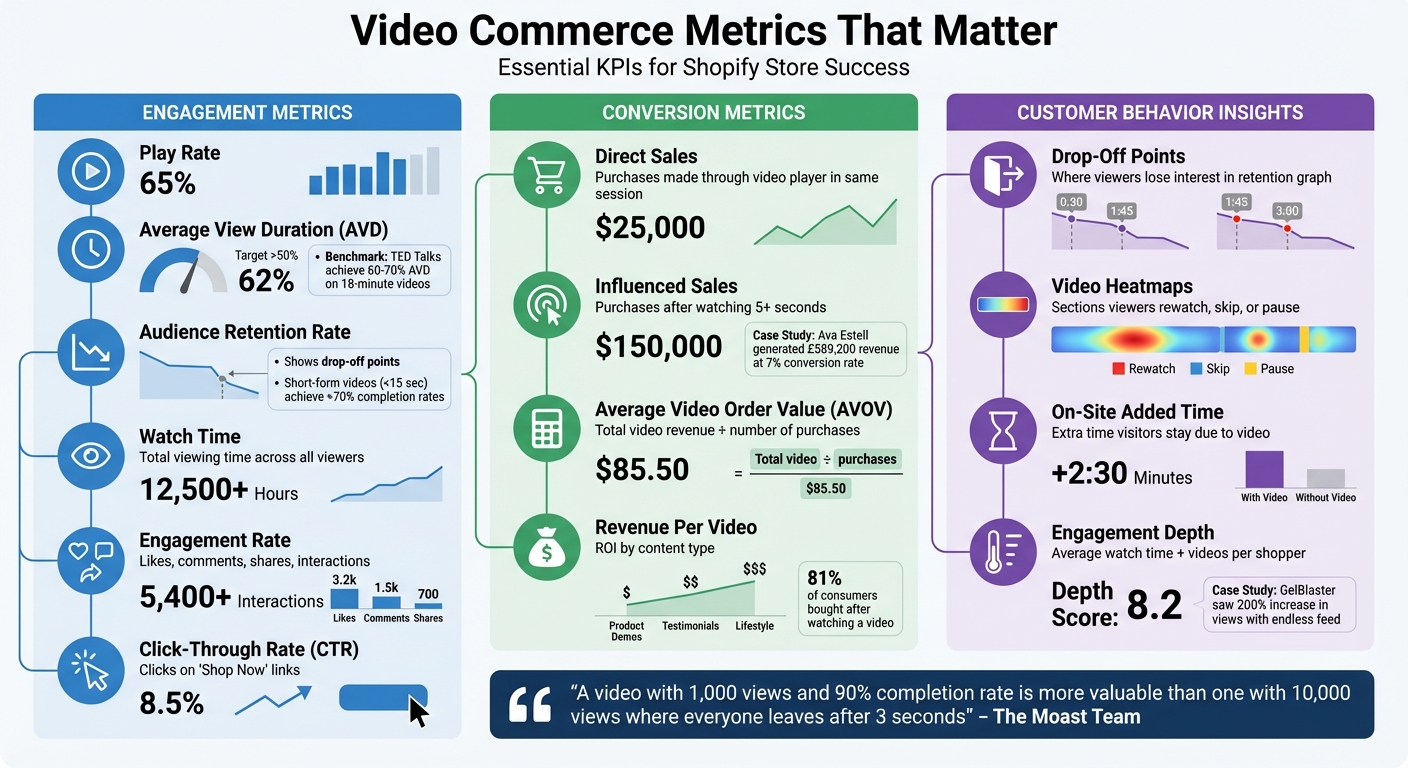
- Metrics that matter: Track play rate, average view duration, audience retention, direct sales, and influenced sales.
- Revenue impact: Examples like Headphonezone.in show $570,000 in video-driven revenue with a 20.2% conversion rate.
- Tools for tracking: Use Google Analytics 4, the Google & YouTube app, or UWidget to measure video performance.
- Actionable strategies: Leverage A/B testing, audience segmentation, and remarketing to improve conversions.
Video analytics go beyond views, offering data on engagement, drop-off points, and purchasing behavior. By setting up tools and refining strategies, Shopify merchants can increase conversions, extend site session times, and boost revenue.
Key Video Commerce Metrics to Track
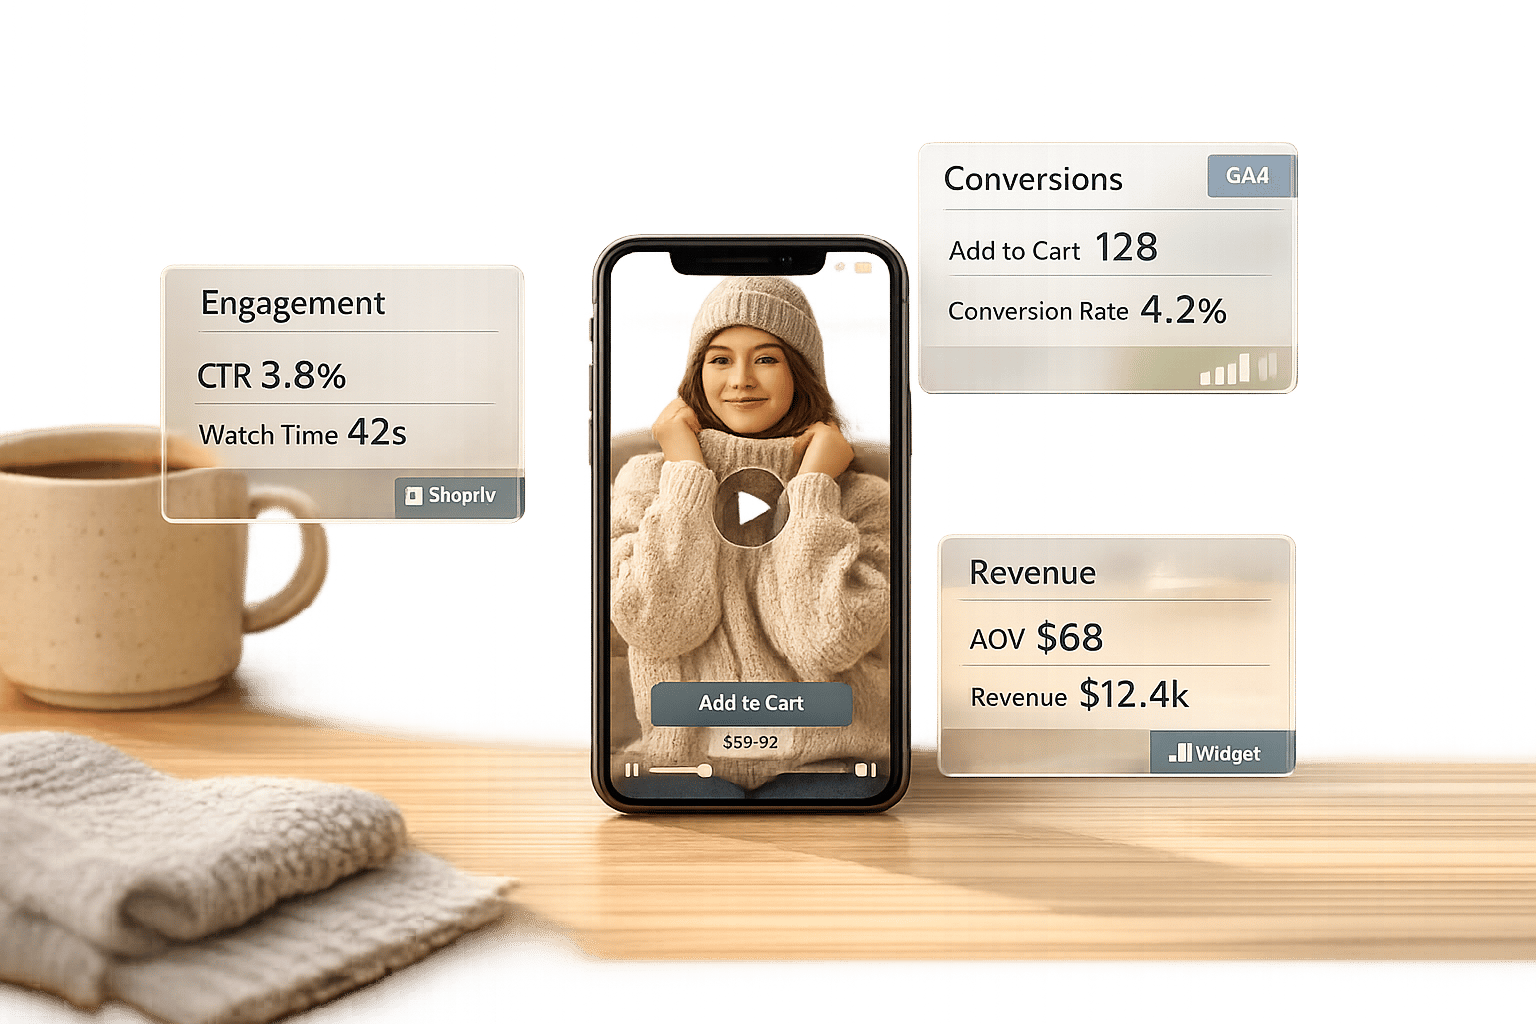
Video Commerce Metrics Dashboard: Key Performance Indicators for Shopify Stores
Tracking the right metrics removes guesswork and helps you make smarter decisions. Simple view counts won't tell you if viewers engaged with your content or moved closer to making a purchase. The metrics below provide deeper insights into your video commerce strategy, showing what's working and where you might be losing potential customers.
Engagement Metrics
Play rate measures the percentage of page visitors who click play on your video. This metric reflects how well your video placement and thumbnail grab attention. Once viewers hit play, average view duration (AVD) becomes key - an AVD above 50% is a solid indicator of engagement. For instance, TED Talks, with their average length of 18 minutes, often maintain a 60–70% AVD.
Another important metric, audience retention rate, highlights where viewers drop off or re-watch specific parts of your video. A dip in the retention curve can signal weak spots in your content. Short-form videos, like TikToks under 15 seconds, often achieve completion rates over 70%, proving that concise, focused content can outperform longer formats.
Metrics like watch time (total viewing time) and engagement rate (likes, comments, shares, and interactions) reveal how valuable your content is to both viewers and platform algorithms. Meanwhile, click-through rate (CTR) on "Shop Now" links directly measures how effectively your video nudges viewers toward making a purchase.
Together, these engagement metrics offer a clear picture of how your videos are performing and how that performance ties back to sales.
Conversion Metrics
When it comes to profitability, revenue metrics separate entertaining videos from those that drive results. Direct sales occur when viewers add a product to their cart through the video player and complete the purchase in the same session. Influenced sales, on the other hand, happen when someone watches at least five seconds of a video and later makes a purchase, even if they don’t use the video player’s checkout option.
For example, Ava Estell generated £589,200 in revenue from video shoppers with a 7% conversion rate by using shoppable video content to guide customer decisions. This demonstrates how video content can directly boost conversions.
Average Video Order Value (AVOV) calculates the average spend of video-driven orders by dividing total video-related revenue by the number of such purchases. Another key metric, revenue per video, helps pinpoint which types of content - like user-generated clips or professional demos - yield the best return on investment. With 81% of consumers saying they’ve bought a product after watching a video, tracking these metrics is critical for understanding the financial impact of your video strategy.
Customer Behavior Insights
Looking beyond sales numbers, customer behavior metrics offer a deeper understanding of the shopping journey. Drop-off points in your retention graph reveal where viewers lose interest. For example, if a significant drop happens when a call-to-action (CTA) appears, it may be time to rethink its design or move it earlier in the video.
Video heatmaps provide another layer of insight, showing which sections viewers re-watch, skip, or pause. This can highlight which product features resonate most. Additionally, on-site added time measures how much longer visitors stay on your site because of your video content, which can boost both SEO and conversion potential.
"A video with 1,000 views and a 90% completion rate is way more valuable than one with 10,000 views where everyone leaves after three seconds." – The Moast Team
Engagement depth, which includes metrics like average watch time and videos viewed per shopper, helps distinguish casual browsers from serious buyers. For instance, GelBlaster’s Growth Strategist Peter Lobanov shared that introducing an "endless feed" of shoppable content led to a 200% increase in views and a noticeable jump in conversions. This kind of data also allows for behavioral retargeting, such as targeting users who watched more than 75% of a video but didn’t make a purchase.
Setting Up Video Analytics in Shopify
Want to connect your Shopify store's video content directly with performance data? Setting up video analytics is simpler than it might seem. Here’s how you can track video performance using three different methods.
Setting Up Google Analytics 4
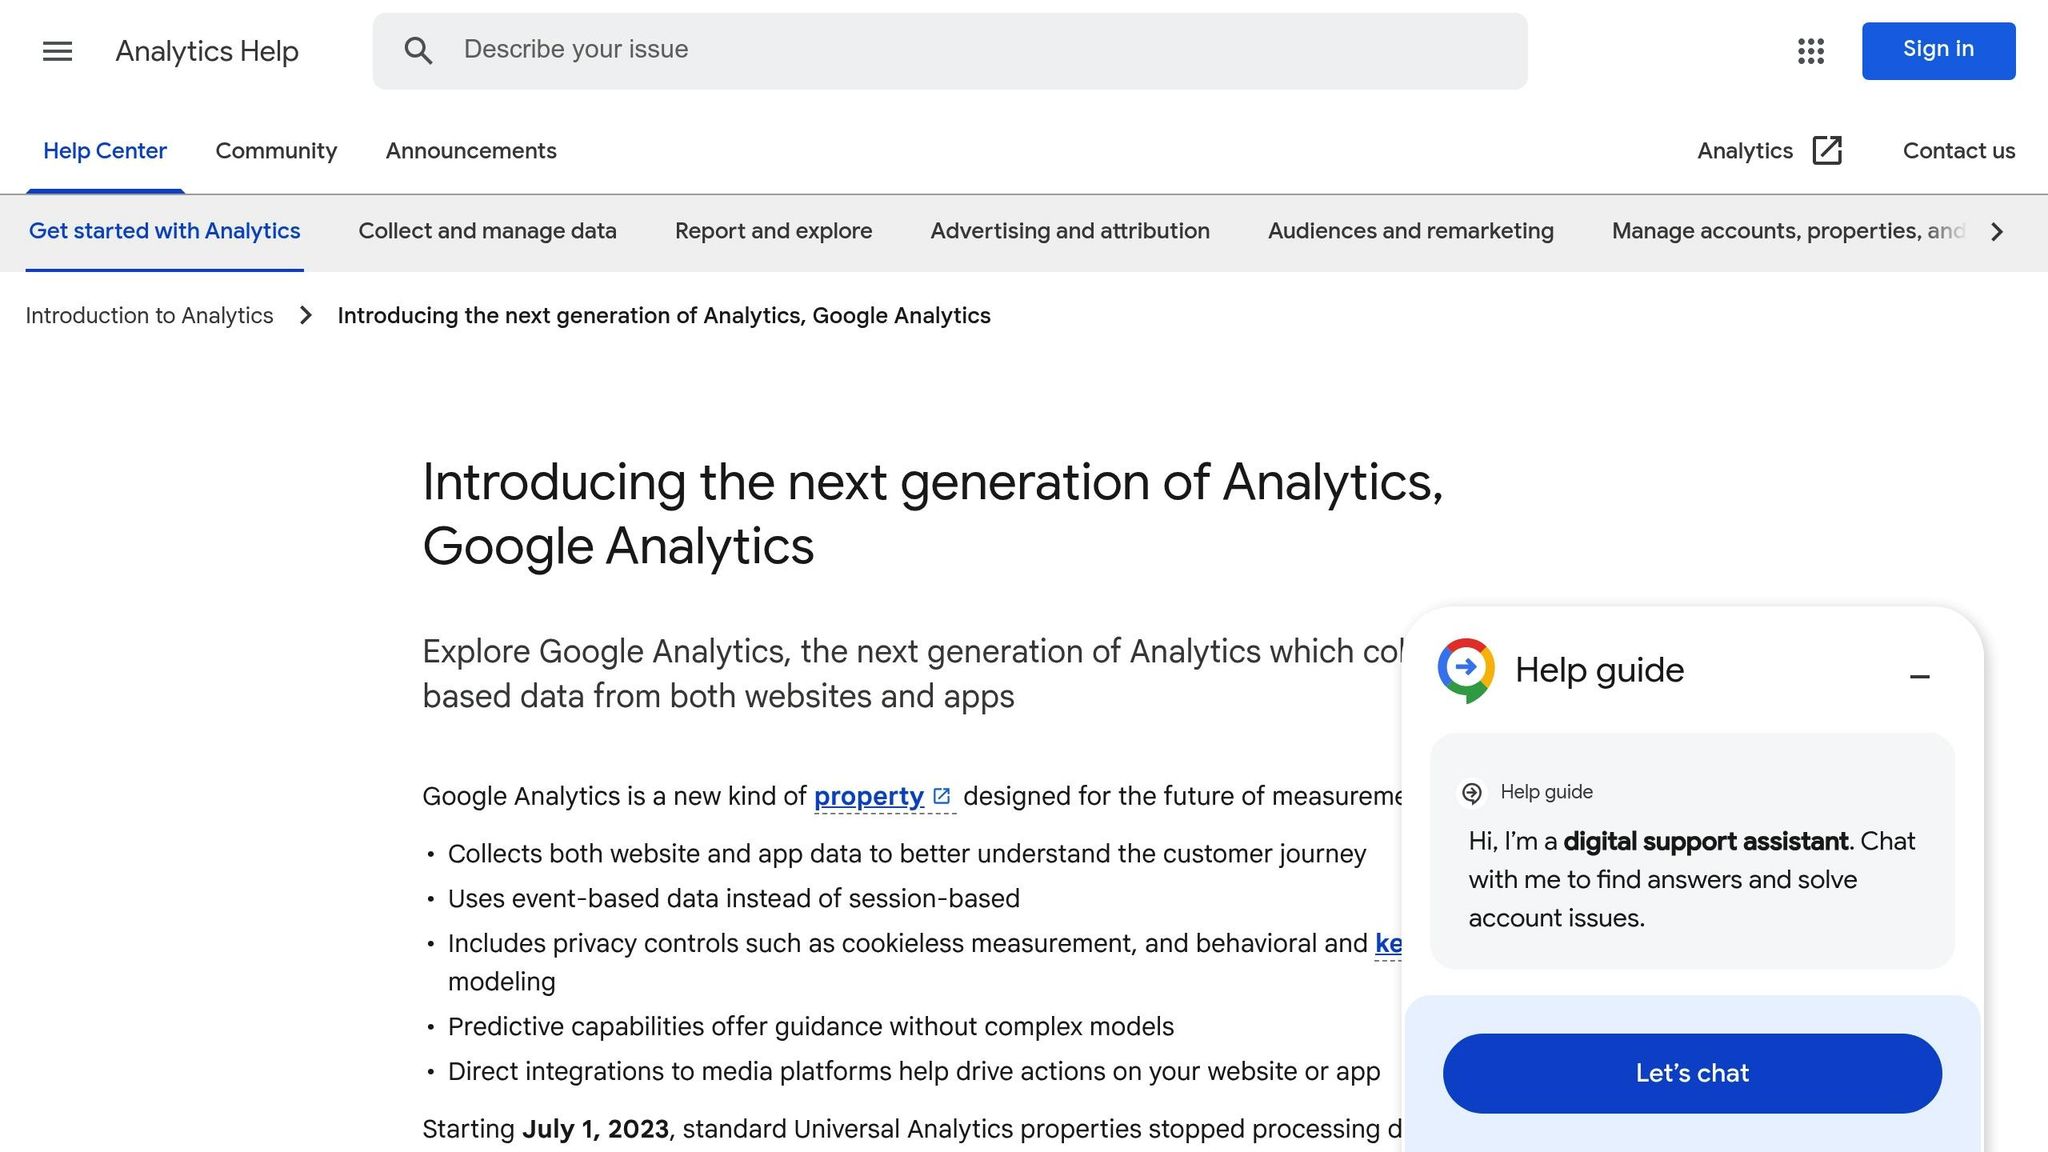
Google Analytics 4 (GA4) makes tracking YouTube video interactions a breeze with its Enhanced Measurement feature. To get started, enable Video engagement under the Data Stream's Enhanced Measurement settings. Once activated, GA4 automatically tracks key events like:
- video_start: When a video begins playing.
- video_progress: Recorded at 10%, 25%, 50%, and 75% of the video.
- video_complete: When the video finishes.
These events include useful details such as the video’s title, duration, and URL. To ensure this works with embedded YouTube videos, make sure the iframe URL includes enablejsapi=1.
GA4 takes about 24–48 hours to reflect these events in its reports. For deeper insights, you can register parameters like video\_title or video\_percent as custom dimensions. To confirm your tracking setup is working correctly, use Google Tag Assistant to test your tags.
For an even smoother experience, consider pairing GA4 setup with the Google & YouTube app.
Using the Google & YouTube App
The official Google & YouTube app from the Shopify App Store simplifies the entire analytics setup. After installing the app, link it to your Google account with administrative access. The app automatically maps Shopify events - like purchases, add-to-cart actions, and checkout starts - to Google Ads conversion actions. It also installs Google tags for all connected services.
To improve measurement accuracy, enable Enhanced Conversions within the app. This feature uses hashed, first-party data for better tracking. Additionally, mark new conversion actions as "primary" in Google Ads to optimize your bidding strategy.
Tracking Videos with UWidget
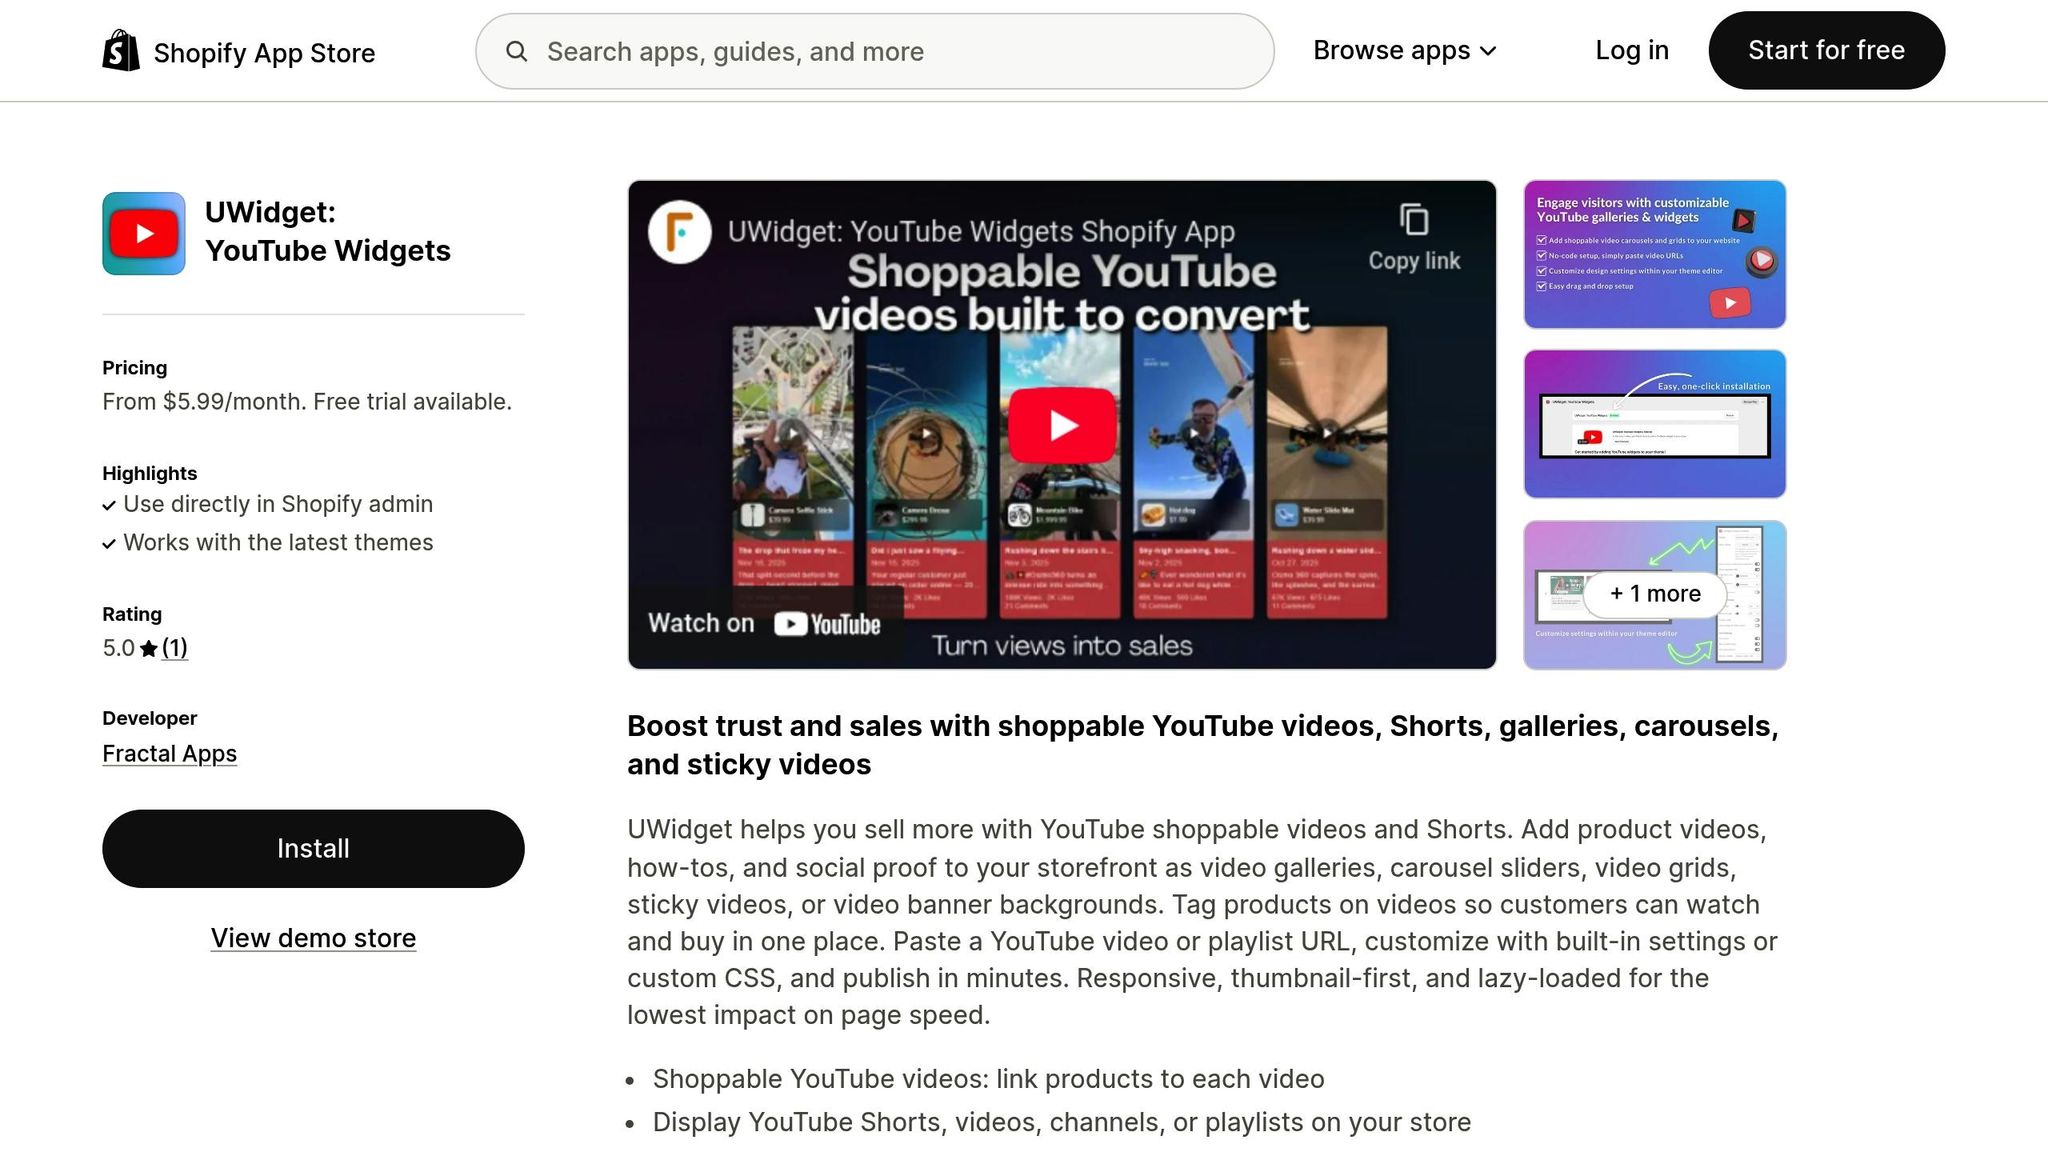
For a more integrated solution, consider UWidget: YouTube Widgets. This app combines flexible video display options with built-in engagement tracking. UWidget allows you to embed YouTube videos and Shorts in various layouts, such as carousels, grids, sticky players, or banner backgrounds.
Installing UWidget is simple. Find it in the Shopify App Store, click Add app, and confirm the installation. Then, paste any YouTube video, Shorts, or playlist URL into the app interface to add content to your store. UWidget also includes shoppable features, letting customers purchase products directly from the video player.
The app uses techniques like thumbnail-first loading and lazy loading to keep page speeds fast while ensuring a responsive experience. It’s a favorite among merchants, earning a 5.0-star rating on the Shopify App Store. As one user from Wholesale Nursery Co shared:
"I am pleased with this app. It allows shorts and videos to be displayed and easily integrated on my e-commerce store."
UWidget offers a range of pricing plans to suit stores of all sizes, and all plans include a free trial.
How to Improve Video Performance
Once your video analytics are in place, it’s time to use that data to elevate your video’s impact. The difference between a video that drives results and one that falls flat often boils down to smart testing and precise audience targeting.
A/B Testing Video Placement
Testing where your videos appear can shift the focus from vanity metrics like views to actions that actually drive sales. Instead of guessing, experiment with placing videos strategically on product pages - try carousels at the top, galleries in the middle, or sticky players that follow users as they scroll.
Make sure to test one element at a time. For instance, compare different thumbnails or tweak the timing of your call-to-action (e.g., after 30 seconds versus at 75% video completion). Studies show that thoughtful video placement can lead to significant conversion boosts.
To track the impact of these changes, use UTM parameters to identify traffic sources in GA4. Video is becoming an essential tool - by 2025, 89% of companies are expected to include it in their marketing strategies, and 84% of marketers already credit video with driving increased sales.
Once you find the most effective placement, dive deeper by segmenting your audience for even better engagement.
Building Targeted Audiences
Not all viewers are equal. Someone who watches 80% of your demo is much more engaged than someone who drops off early. Use your analytics to identify these high-intent viewers and segment them into specific groups for remarketing.
For example, create a custom audience of users who watched more than 75% of a video but didn’t make a purchase. This approach often leads to noticeable revenue increases.
If your analytics tool offers heatmap data, pay close attention. When viewers repeatedly watch certain sections, it’s a clear sign they’re interested in specific features. If multiple people re-watch a particular part of your video, you could create a segment targeting shoppers who value quality and emphasize those product strengths in future content.
These refined audience segments set the stage for effective remarketing campaigns, ensuring your message resonates with viewers who are more likely to buy.
Remarketing to Video Viewers
Here’s a tough reality: around 97% of first-time visitors won’t return. That’s where remarketing comes in - it’s your chance to re-engage with viewers when they’re closer to making a purchase.
One powerful tactic is sequential retargeting. Let’s say someone watches your introductory brand video but doesn’t buy. Follow up with a second ad featuring customer testimonials or addressing common objections. In 2022, GelBlaster saw a 200% jump in video views after adding interactive video feeds with frictionless buy buttons. Growth Strategist Peter Lobanov reported major improvements in both retention and conversions.
For viewers who add items to their cart but don’t complete checkout, try running ads with limited-time discounts to create urgency. RIFRUF, led by CEO Peter Liu, generated $33,000 in revenue from 10,000 viewers who watched 18,600 shoppable videos, simply by placing videos in high-impact spots.
Finally, set up remarketing audiences in Google Ads based on specific behaviors. For instance, target users who subscribed to your channel, visited your channel page in the last 30 days, or viewed any video as an ad in the past 2–7 days. Each group represents a different level of familiarity with your brand, so tailor your messaging accordingly.
sbb-itb-d9e5b3a
Reading Video Performance Reports
Digging into video data can help you uncover insights that drive sales. While many Shopify store owners focus on view counts, the real value lies in understanding how videos impact revenue, where viewers lose interest, and which content deserves more investment. These insights are key to improving monetization, engagement, and conversion rates.
Monetization Overview Reports
Break down Direct Sales and Influenced Sales as separate metrics. This approach paints a clearer picture of how videos contribute to your revenue.
For example, in 2022, Headphonezone.in tracked these metrics using automated shoppable video tools and saw $570,000 in revenue from video shoppers, with an impressive 20.2% conversion rate.
Also, compare your Average Video Order Value (AOV) to the overall site average. If video shoppers tend to spend more, they could be high-value customers worth targeting with premium content. Identify which products frequently show up in video-driven purchases - these are your top performers and should be featured in future videos.
Engagement and Funnel Analysis
Audience Retention graphs are your go-to for spotting where viewers lose interest. A steep drop at the beginning might mean your opening isn’t grabbing attention, while a decline during your call-to-action could indicate issues with your offer or timing. Use the Video Completion Rate to see which videos keep viewers engaged until the end - this data can guide your content strategy.
Another key metric is Added Session Time, which measures how much longer visitors stay on your site after watching a video. Kevin Lee, Co-Founder of immi, highlighted its importance:
"Video has significantly increased the dwell time of traffic to our website, which has a multitude of benefits across SEO & increasing the chance of a conversion".
Monitor the Click-Through Rate (CTR) for your "Shop Now" links or embedded video widgets, like those available through UWidget, to measure how well your videos drive purchasing actions.
Turning Data into Action
Once you’ve gathered performance data, turn it into actionable strategies. For instance, if you have a video with high engagement but low conversions, use retention graphs to identify where the disconnect happens. If most viewers watch 75% of a product demo but don’t buy, consider retargeting them with testimonials or limited-time offers.
Leverage UTM parameters (like utm_source=youtube&utm_campaign=product-launch) to track sales from specific videos in Google Analytics 4. Make adjustments to thumbnails, titles, and calls-to-action (CTAs) to improve results. For example, Apolla used advanced video analytics and shoppable widgets to generate $170,000 in video-driven revenue at a 10.8% conversion rate.
Finally, keep an eye on real-time reports within the first 48 hours of launching a video. This helps you catch viral trends early and act quickly to maximize engagement. With 93% of marketers reporting a positive ROI from video marketing, the most successful Shopify stores regularly review their reports and make timely adjustments to stay ahead.
Next Steps
Key Takeaways
Video commerce analytics is a game-changer for driving revenue, helping you uncover engagement and conversion metrics that matter most. Top-performing Shopify stores prioritize metrics like completion rates, video-influenced conversions, and added session time instead of chasing vanity stats. To back this up, 93% of marketers report seeing a positive ROI from video marketing, and 84% credit video efforts with directly boosting sales.
It's also crucial to differentiate between direct and influenced sales when assessing performance. Audience retention graphs are particularly helpful - they show where viewers lose interest, allowing you to tweak elements like thumbnails, call-to-action timing, or video placement instead of reshooting the entire video. Interestingly, 28% of marketers are already using advanced tools like heatmaps and engagement graphs to stay ahead. With these insights in mind, you can take practical steps to integrate video analytics into your Shopify store.
Getting Started with Video Analytics
To make the most of these metrics, start building a strong foundation in your first 30 days. Begin by setting up Google Analytics 4 (it’s free) and linking it to your store through the "Google & YouTube" app. This setup will automatically track ecommerce events. Adjust the data retention settings from 2 months to 14 months to account for longer sales cycles. Use utm_source=youtube in your video links to monitor traffic and conversions effectively.
Consider tools like UWidget, which offers features like galleries, carousels, sliders, and shoppable video widgets. These tools integrate seamlessly with your analytics, providing insights from video engagement all the way to purchase completion. Establishing a simple routine can make a big difference: track click-through rates (CTR) weekly and analyze retention graphs monthly to fine-tune your video strategy. With 89% of companies projected to adopt video marketing by 2025, getting started now gives you a valuable head start.
FAQs
How can video commerce analytics help boost conversions in my Shopify store?
Video commerce analytics offer a window into how customers engage with your product videos. By diving into metrics such as play rates, watch time, and click-through rates on CTAs, you can pinpoint what grabs your audience’s attention and tweak your approach based on real data.
Fine-tuning your video content, strategically placing it on your store, and carefully timing its display can make a big difference in keeping shoppers interested. This not only minimizes drop-offs but also motivates visitors to take action - boosting conversion rates on your Shopify store.
What are the key metrics to track for success with video commerce?
To gauge how well your video commerce efforts are performing, pay close attention to a few key metrics. Audience retention tells you how much of your video viewers are sticking around to watch, while the click-through rate (CTR) reveals the percentage of viewers who take action, like clicking a link. The conversion rate is another crucial measure, showing how many sales or desired actions result from your video.
You should also keep an eye on total watch time, which reflects overall viewer engagement, and video-driven sales performance, which indicates how much revenue your videos are bringing in. These metrics provide valuable insights to fine-tune your approach and achieve better results.
How can I set up video analytics for my Shopify store with Google Analytics 4?
To set up video analytics on your Shopify store using Google Analytics 4 (GA4), begin by creating a GA4 property and noting down the Measurement ID. Next, add the GA4 tag to your Shopify store by copying the global site tag snippet and pasting it into the Google Analytics field within your Shopify admin. You’ll find this under Online Store → Preferences.
After that, enable Enhanced Measurement in GA4, making sure the Video engagement option is turned on. This feature allows you to track key events like video starts, progress, and completions.
For effective video tracking, use supported players like HTML5 <video> tags. Alternatively, you can embed YouTube videos using an app like UWidget by Fractal Apps, which seamlessly integrates YouTube widgets into your Shopify store. Once everything is configured, check GA4’s real-time reports to confirm tracking is working, and keep an eye on video performance to boost engagement and drive conversions.