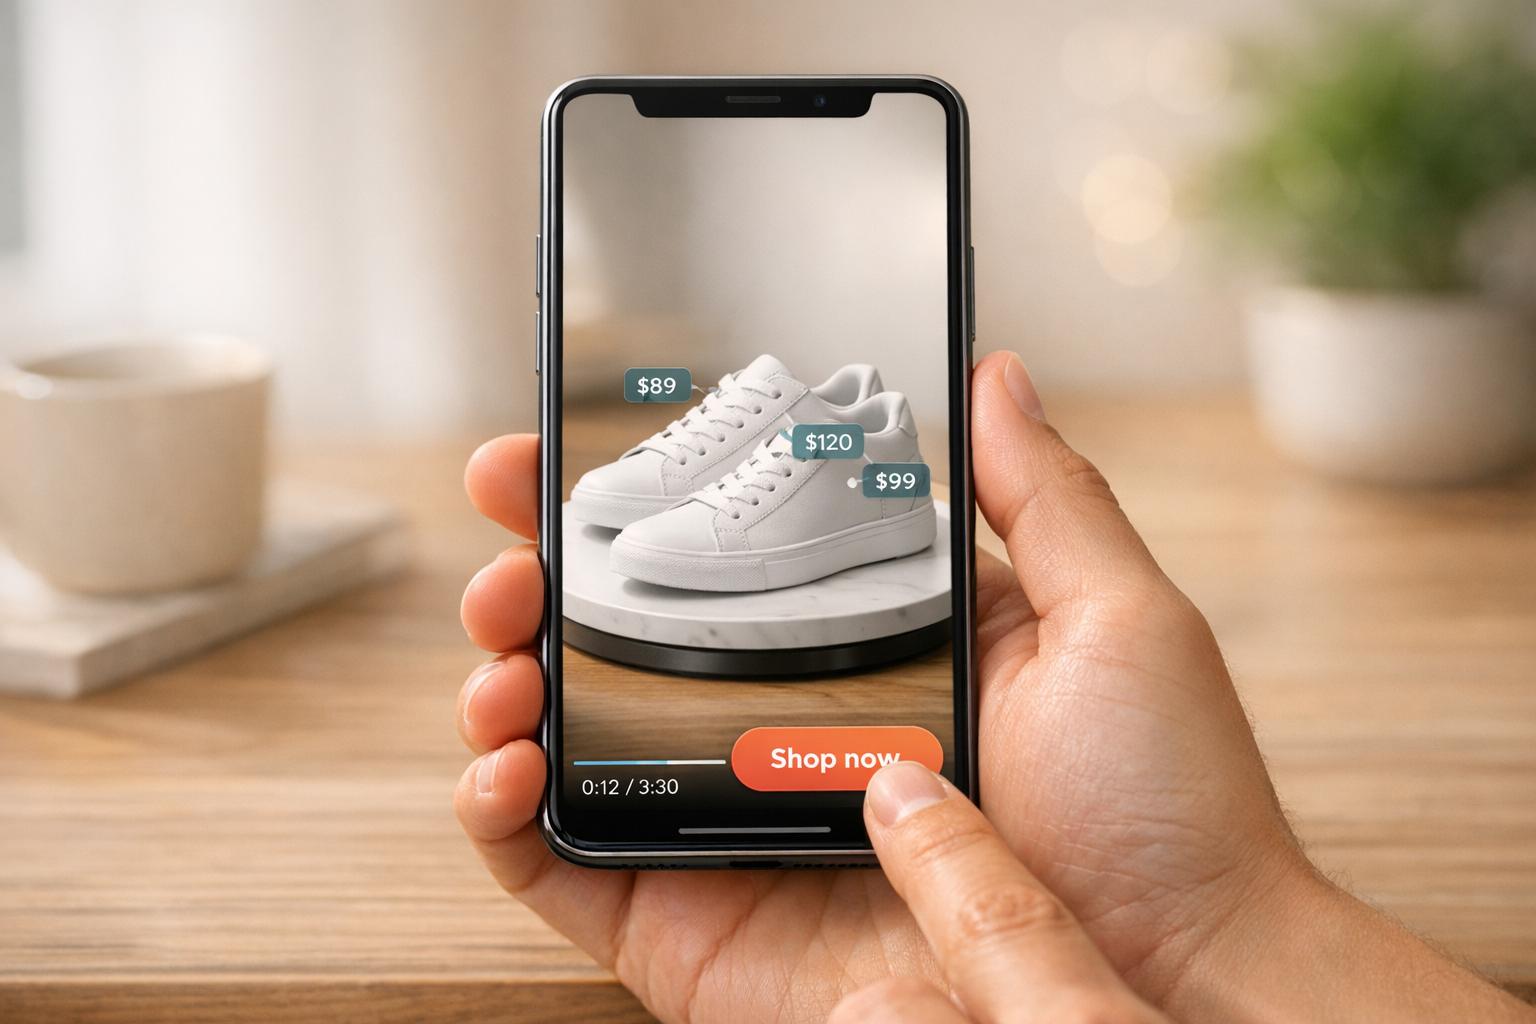
Shoppable videos on YouTube are reshaping online shopping by allowing viewers to buy products directly from videos, Shorts, or live streams. With features like product tagging and Shopify integration, brands are seeing an average 30% increase in conversion rates. YouTube Analytics plays a critical role in optimizing these videos by providing data on product clicks, viewer engagement, and sales performance.
Key Takeaways:
- Shoppable Features: Tag products in videos, live streams, or Shorts; new tools like Google Lens integration simplify product searches.
- Performance Metrics: Track views, impressions, watch time, audience retention, and product tag click-through rates (CTR).
- Engagement Tips: Place product tags before drop-off points, keep videos under 90 seconds, and use captions for sound-off viewers.
- Real-Time Data: Monitor views and engagement within the first 48 hours to capitalize on trends.
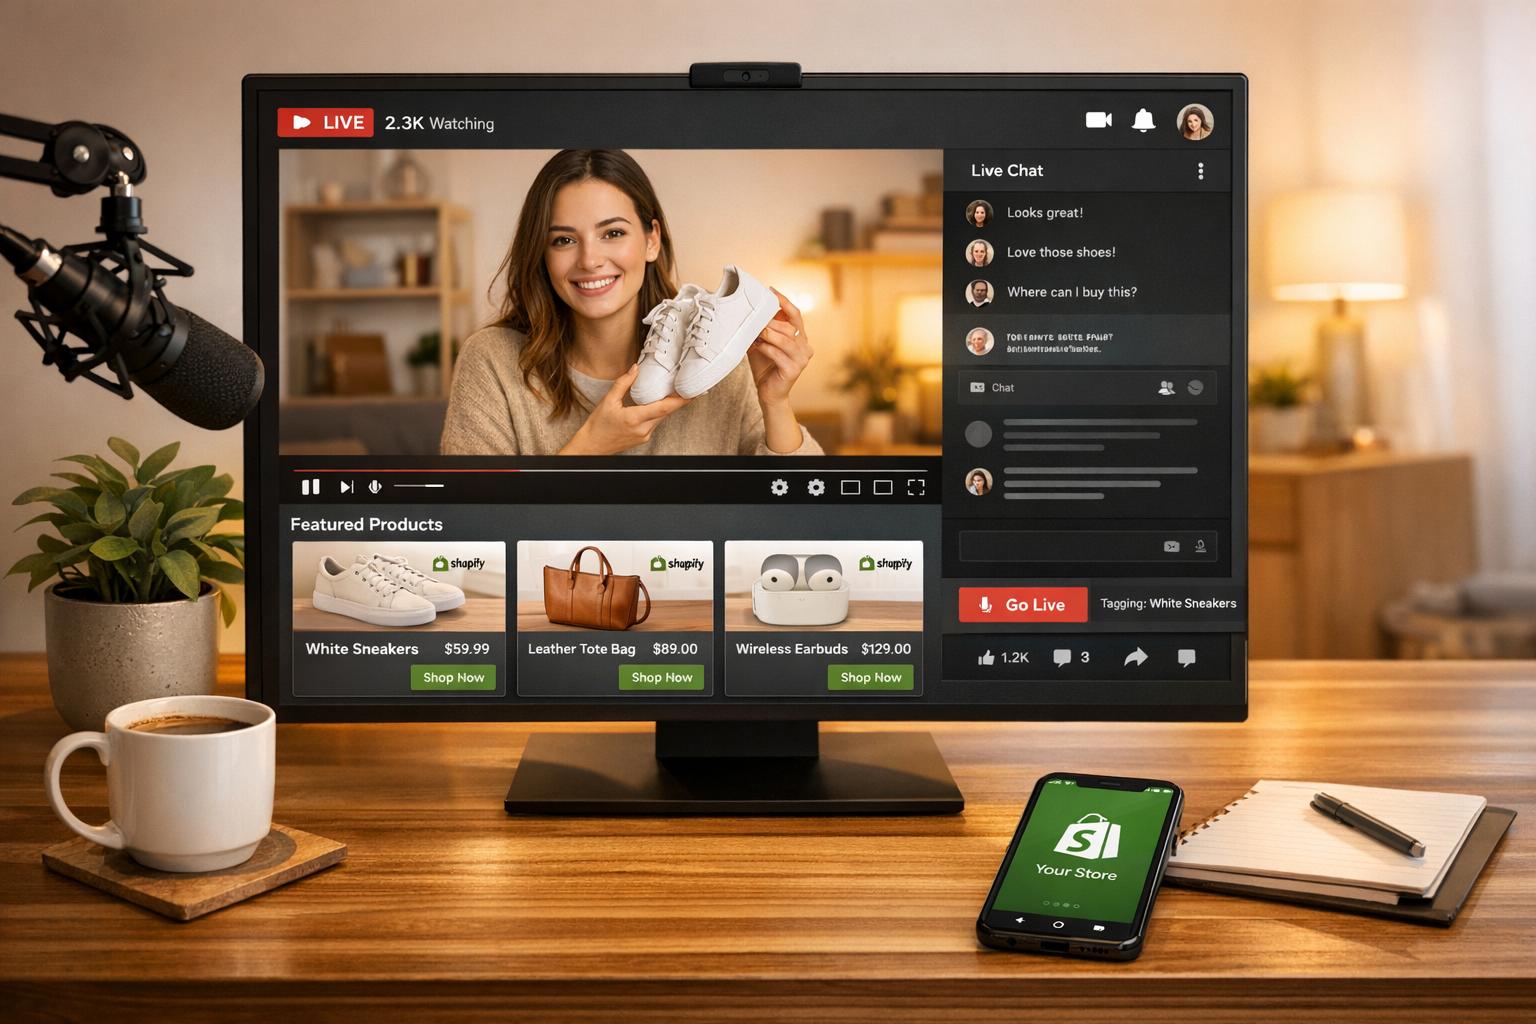
- E-commerce Integration: Tools like UWidget for Shopify help connect YouTube performance with store sales.
YouTube Shoppable Video Analytics: Key Metrics and Performance Statistics
Advanced YouTube Analytics: How to measure the data that actually matters
Key Metrics to Track for Shoppable Video Performance
Understanding the right metrics can transform raw data into actionable strategies. YouTube Analytics offers a wealth of information, but it’s crucial to focus on the metrics that directly impact your e-commerce goals. Metrics like views and impressions are a good starting point. Views show how many times your video was played, while impressions reveal how often your thumbnail was displayed to potential viewers. While these numbers highlight your content's reach, they’re just the tip of the iceberg.
Metrics like watch time and average view duration (AVD) dive deeper into audience engagement. Watch time measures the total minutes viewers spend on your content and plays a key role in YouTube’s recommendation engine. AVD, calculated by dividing total watch time by total plays, helps determine whether your video length aligns with viewer expectations. As Thomas J Law from Oberlo notes:
Watch time is the main driver behind YouTube's algorithm. The platform prioritizes content that keeps users engaged and on the site longer.
For shoppable videos, keeping them under 30 seconds often leads to better engagement.
The audience retention graph is another powerful tool. It shows exactly where viewers stop watching, helping you strategically place product tags before significant drop-off points. Shopping-specific metrics like earnings per view and estimated revenue offer direct insights into how much money your videos generate. Card CTR, which measures how often viewers click on in-video product tags, is another key indicator of how effective your calls-to-action are.
Demographic data, including age, gender, and geography, provides valuable insights into your audience. This information helps you align product offerings with viewer profiles and logistics capabilities. As Michael Keenan from Shopify explains:
Reviewing the age and gender of your video audience may offer new information to build your future product videos upon.
Traffic source reports round out the picture by showing how viewers find your content - whether through YouTube search, suggested videos, or external websites. This helps pinpoint which promotional strategies bring in the most engaged audiences.
Key Metric Categories
| Metric Category | Key Metric | E-commerce Significance |
|---|---|---|
| Reach | Impressions CTR | Evaluates how well your thumbnail and title attract viewers |
| Engagement | Audience Retention | Highlights moments where interest peaks or drops |
| Conversion | Card CTR | Tracks how often viewers interact with product tags or links |
| Revenue | Earnings per view | Shows the ROI for each view |
| Audience | Top Geographies | Helps identify regions with strong shipping/logistics potential |
Views and Impressions
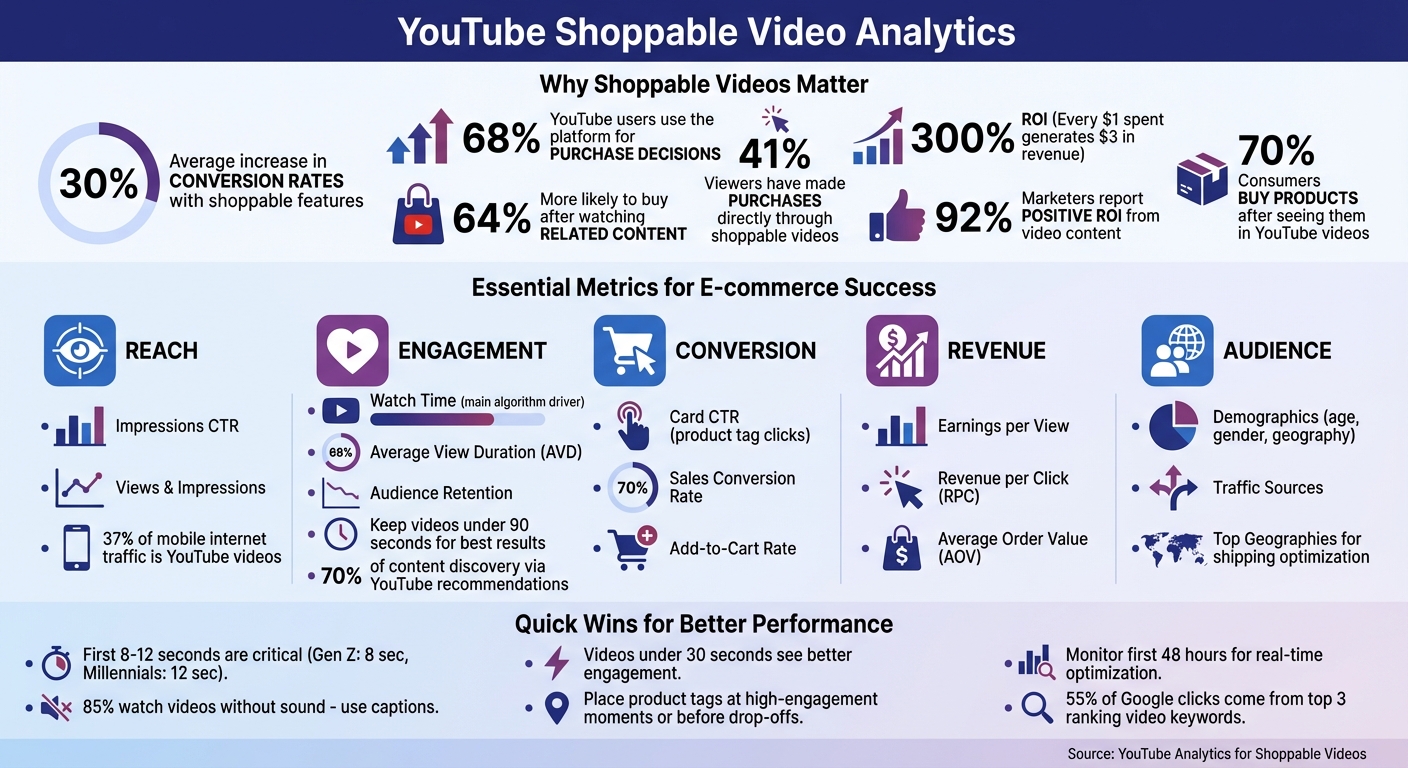
Views and impressions provide a snapshot of your content’s reach. Views represent the total plays, while impressions indicate how often your thumbnail appeared to users. If impressions are high but views are low, your thumbnail or title might not be compelling enough to drive clicks. Impressions CTR measures this conversion rate - 1,000 impressions resulting in 100 clicks would mean a 10% CTR. Considering YouTube videos account for about 37% of all mobile internet traffic, these metrics are essential for gauging your potential audience.
Engagement Metrics
Metrics like average view duration and audience retention reveal how well your content keeps viewers engaged. A low AVD might indicate that your video is too long or doesn’t provide value quickly enough. Audience retention graphs allow you to compare performance across your last 10 videos of similar length, helping you identify what resonates with viewers. High AVD and CTR are crucial for getting featured in YouTube’s recommendation algorithm, which drives around 70% of content discovery on the platform. Kartik from CedCommerce emphasizes:
YouTube elevates videos (and channels) that prove meaningful engagement, which is exactly what AVD and CTR do.
Shopping-Specific Metrics
For shoppable videos, metrics like sales conversion rate and add-to-cart rate measure the direct impact on revenue. Around 41% of viewers have made purchases directly through shoppable videos. Average order value (AOV) indicates whether your content encourages larger purchases or successful upselling. Revenue per click (RPC) calculates the average earnings per product link click, helping you identify the most financially effective interactive elements. Shoppable videos have been shown to deliver a 300% ROI, meaning every $1 spent can generate $3 in revenue.
Click-Through Rate (CTR) for Product Tags
Card CTR measures how often viewers click on in-video product tags or panels. A high CTR suggests your tag placement, timing, and call-to-action are effective in moving viewers toward a purchase. Use audience retention heatmaps to identify peak engagement moments and strategically place product tags during those times. If your impressions CTR is strong but card CTR is low, it could indicate that while your thumbnail attracts attention, the video content or tag placement needs adjustment. A/B testing different tag placements and call-to-action phrasing can help optimize these metrics.
Audience Demographics and Traffic Sources
Demographic insights - such as age, gender, and geography - allow you to refine your content and product offerings to better match your audience. For instance, knowing the top geographies of your viewers can help you focus on regions with efficient shipping options. Traffic source data shows where viewers are finding your content, whether through search, suggested videos, or external platforms. Since 55% of all Google clicks come from the top three ranking video keywords, optimizing your titles and descriptions based on these insights can significantly improve discoverability.
These metrics collectively serve as the building blocks for refining your shoppable video strategy and maximizing its impact.
How to Optimize Shoppable Videos Using Analytics Data
By focusing on retention, traffic, and interaction data, you can fine-tune your shoppable videos for better performance. With tools like YouTube Analytics, you’ll get a clear picture of what’s working and what isn’t, providing actionable insights for improvement.
Improving Engagement and Retention
Audience retention graphs are your go-to for spotting where viewers lose interest. These drop-off points highlight sections that might need trimming or reworking. To grab attention right away, pack your most engaging content into the first 8 to 12 seconds. Research shows Gen Z viewers typically decide within 8 seconds, while Millennials give you about 12 seconds before making up their minds.
Since 85% of social media users watch videos without sound, adding captions and on-screen text is a must. These elements not only keep viewers engaged when the sound is off but also help emphasize key product benefits. Traffic source data can also give you insight into viewer intent. For example, search traffic often comes from users actively seeking solutions, so they’re more likely to stay engaged if your content delivers immediate value. On the other hand, viewers coming from suggested videos may require more storytelling before they’re ready to interact with product tags.
For the best results, aim to keep your shoppable videos under 90 seconds. Use YouTube Analytics' comparison tool in Advanced Mode to test different video lengths and formats, helping you see what resonates most with your audience. As Neil Patel, Co-Founder of NP Digital, puts it:
YouTube Analytics is essential to running any successful YouTube campaign.
Once you’ve optimized viewer engagement, it’s time to focus on product tag placement.
Better Product Tag Placement
The key to effective product tagging lies in timing. Use your retention graph to identify high-engagement moments or just before drop-offs to strategically place tags. Metrics like "Top Cards" and "End Screens" in YouTube Analytics can show which tags are being clicked, offering clues on whether placement or teaser text needs adjustment.
Tags should align with moments when the product is actively demonstrated - like showing a coat being worn or a "before and after" transformation. This makes the tag feel like a natural part of the content, not a disruption. For shorter videos (under 30 seconds), include clickable elements early to grab attention before viewers scroll away. Use real-time reporting in the first 48 hours to track engagement spikes and assess the impact of your tag placements.
Testing and Iterating Content
Testing allows you to refine your approach even further. A/B testing different video formats, tag placements, thumbnails with bold colors, and call-to-action phrases can reveal what works best for your audience.
| Metric | Insight | Action |
|---|---|---|
| Audience Retention | Where viewers lose interest | Trim slow parts; move tags earlier |
| Card Click Rate | How effective product tags are | Adjust tag text or visuals if clicks lag |
| Traffic Sources | How viewers are finding your video | Optimize SEO for top-performing terms |
| Subscriber Ratio | If the video builds long-term brand loyalty | Promote high-ratio videos more heavily |
Adding chapters with timestamps can help viewers jump straight to the products they’re curious about, which can actually boost retention for specific segments. Keep an eye on metrics like sales, orders, and clicks from product tags to measure direct ROI. You can also calculate your subscriber ratio (views divided by net subscriber gain) to identify which video formats are worth further investment. As Michael Keenan from Shopify wisely notes:
As a creator or a marketer, data is a gift you shouldn't ignore. Otherwise, you're shooting in the dark every time.
sbb-itb-d9e5b3a
Using UWidget to Track YouTube Analytics on Shopify
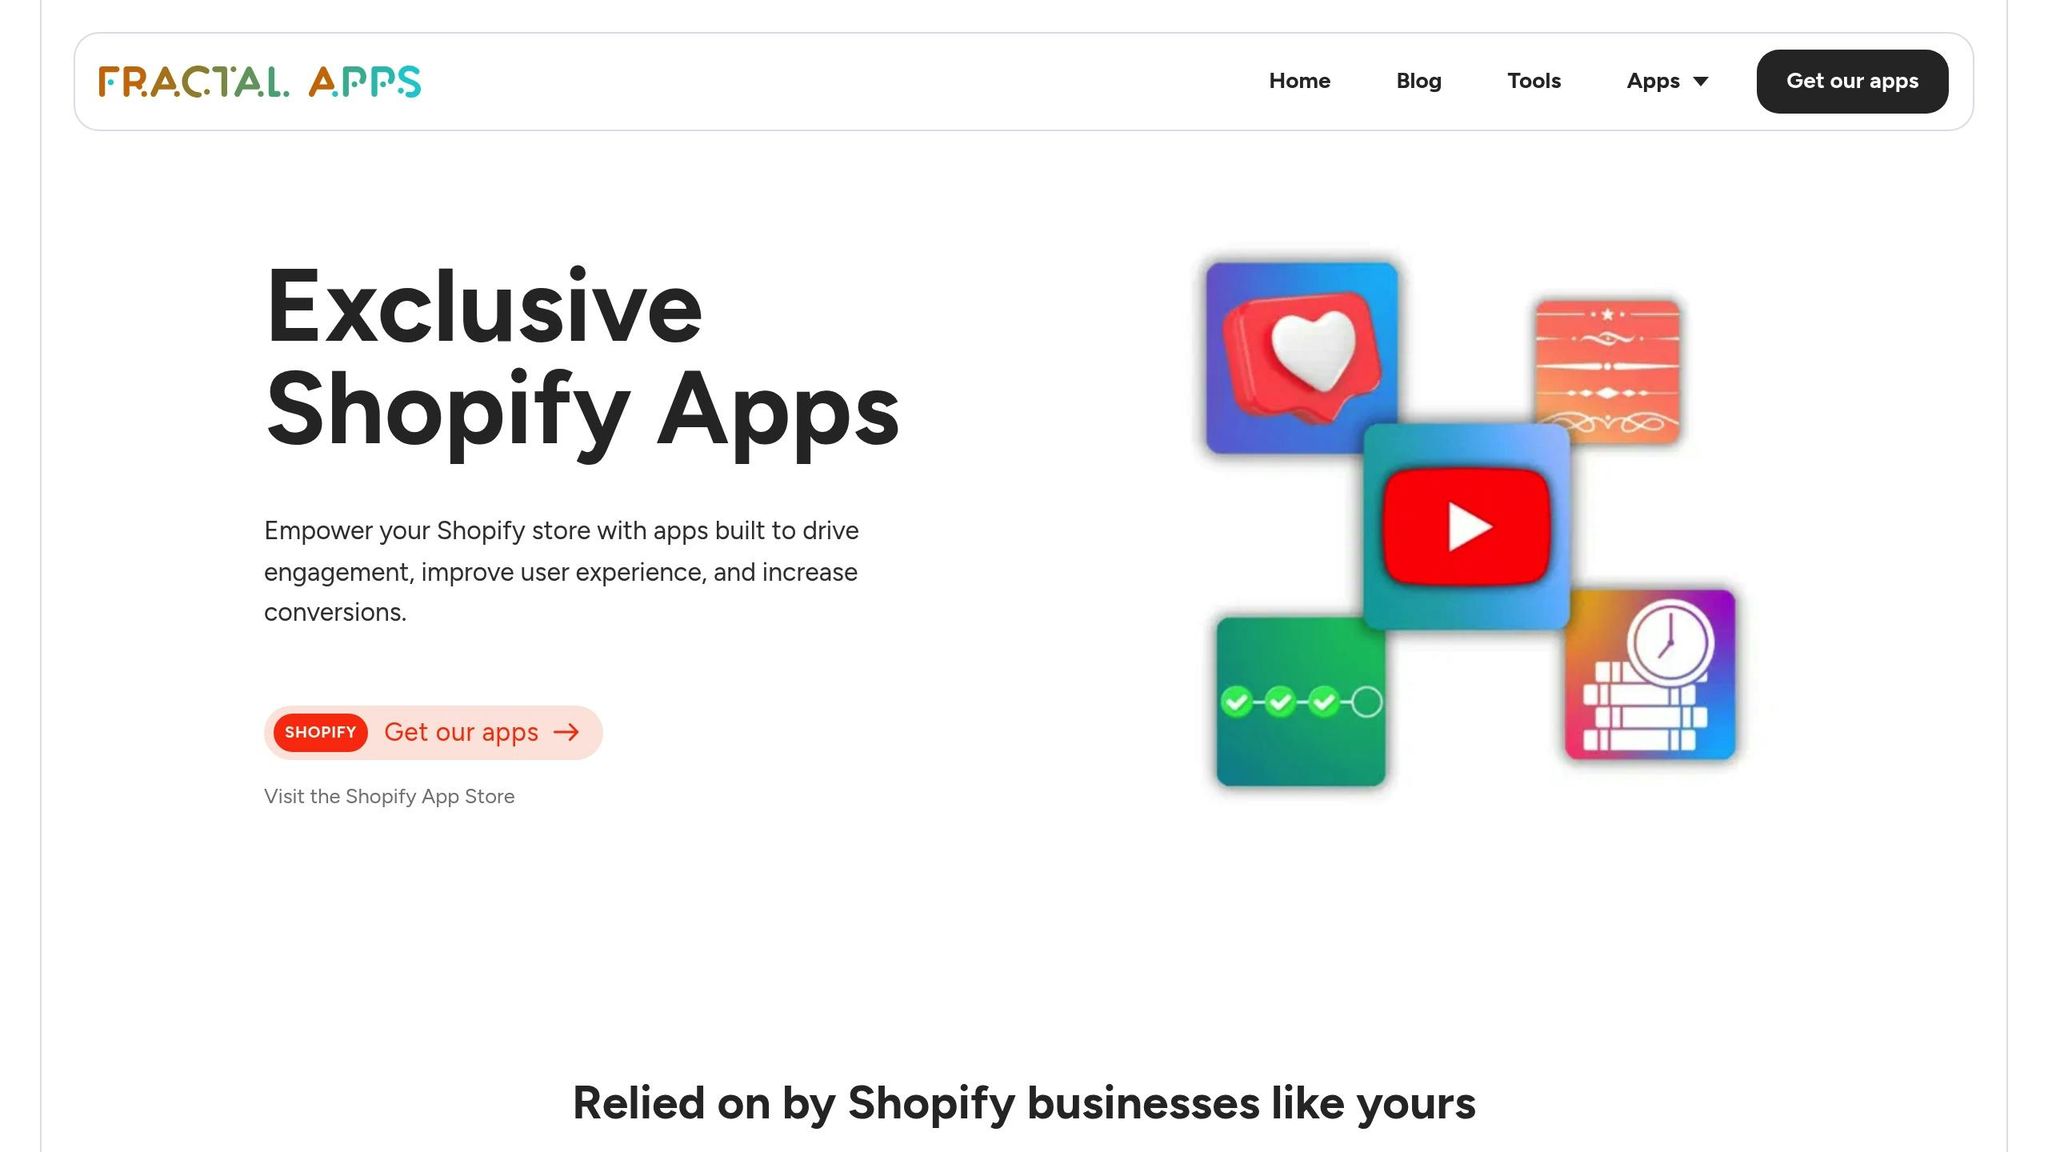
Adding YouTube videos to your Shopify store doesn't mean sacrificing performance insights. UWidget by Fractal Apps makes it easy to embed YouTube content while keeping track of visitor engagement - all with a straightforward setup.
How UWidget Enhances Analytics Tracking
UWidget transforms your Shopify store into a video-driven sales platform, supporting features like galleries, carousels, sliders, sticky videos, YouTube Shorts, and playlists. The setup couldn’t be simpler: just paste a YouTube URL, pick your preferred format, and the widget is ready to go. This user-friendly approach has earned UWidget a perfect 5.0/5 rating on the Shopify App Store.
The app lets you track critical metrics, including views, watch time, engagement, clicks on product tags, sales generated, and total order volume - all directly within your store. For shoppable videos, these insights help pinpoint which content is driving purchases.
With its strong support for YouTube Shorts, UWidget is especially relevant in today’s short-form video landscape. As one satisfied merchant from Wholesale Nursery Co shared:
I am pleased with this app. It allows shorts and videos to be displayed and easily integrated on my e-commerce store.
This seamless tracking not only provides clarity on video performance but also lays the groundwork for more meaningful customer interactions.
Why Shopify Store Owners Love UWidget
Beyond its analytics capabilities, UWidget boosts customer engagement by linking performance data to shopper behavior. It turns video content into an interactive tool for engagement. Features like sticky videos ensure your promotional content stays visible as customers explore your store, while carousel layouts let you showcase multiple products or tutorials without overwhelming the design. Pricing starts at $5.99/month, with a free trial available.
The real value lies in bridging your YouTube data with your store’s conversion metrics. By identifying which videos lead to more orders, you can focus on the content that connects best with your audience. Plus, built-in subscribe cards help grow your YouTube channel directly from your store traffic, creating a cycle where engagement drives loyalty and vice versa.
Advanced Analytics Strategies for E-commerce Growth
Using Audience Data for Targeted Campaigns
Your YouTube Analytics audience data provides a treasure trove of insights into viewer demographics, allowing you to craft content that resonates. For example, if your analytics show that a significant portion of your audience consists of women aged 25–34 in California, you could create localized content featuring seasonal products or special shipping offers tailored to that region.
The "Other channels" data is another goldmine. If your viewers frequently watch cooking channels, consider teaming up with food influencers to showcase products like kitchen gadgets or ingredients. Meanwhile, the Research tab can help you spot trending searches, enabling you to address content gaps with shoppable videos that meet high-demand product queries. Additionally, the "When your viewers are on YouTube" report lets you identify peak activity times - perfect for scheduling live shopping events or product launches to maximize engagement. These insights help transform analytics into actionable strategies that directly impact sales.
Connecting Analytics with Sales Goals
Once you've tapped into audience data, the next step is tying analytics to measurable sales outcomes. Start by focusing on metrics like Sales Conversion Rate, which tracks the percentage of viewers who make a purchase, and metrics like RPC (Revenue Per Click) and AOV (Average Order Value), which reveal how well your videos drive purchases and whether they encourage larger orders.
The stats are compelling: 70% of consumers buy products after seeing them in YouTube videos, and viewers are 64% more likely to purchase after watching related content. To make the most of this, integrate your product catalog using tools like Google Merchant Center or Shopify to keep pricing and stock levels accurate in real time. Stay alert to viral moments by monitoring the Real-Time report. If a video starts gaining traction on platforms like Reddit or Twitter, you can quickly adjust your ad spend to ride the wave of increased visibility.
Tracking Long-Term Performance
Short-term wins are great, but long-term growth relies on metrics like watch time and subscriber growth. Watch time - the total minutes viewers spend on your content - carries more weight than raw view counts because it's a key factor in YouTube's recommendation algorithm. High watch time ensures your videos remain visible, driving consistent sales over time.
Subscriber ratio is another essential metric. Divide views by net subscriber gain to assess how well your content builds loyalty. For instance, a product demo with 10,000 views and 200 new subscribers (a 50:1 ratio) fosters stronger brand loyalty than a viral hit with 100,000 views but only 500 new subscribers (a 200:1 ratio). Comparing returning versus new viewers can also reveal whether your content is cultivating lasting customer relationships.
Use the "Key moments for audience retention" tool to identify where viewers drop off in your videos. Reviewing this data across your last 10 uploads can help you refine product tag placement and pacing for future content. As Michael Keenan from Shopify aptly puts it:
Data is a gift you shouldn't ignore. Otherwise, you're shooting in the dark every time, unaware of whether you're getting closer to or further away from your target.
To take it a step further, download CSV reports from YouTube Studio and align video performance with your 90-day sales data. This approach helps pinpoint which content consistently attracts high-value customers, giving you a clear roadmap for future campaigns.
Conclusion
YouTube Analytics transforms guesswork into actionable strategies for shoppable videos. The numbers speak for themselves: 68% of YouTube users turn to the platform for purchase decisions, and viewers are 64% more likely to buy after watching related content.
Instead of chasing vanity metrics like view counts, dive deeper into engagement. Metrics such as watch time, drop-off points, and high-conversion demographics provide valuable insight into what drives actual sales. Use traffic source data to fine-tune your SEO approach, and take advantage of real-time reports to make the most of viral trends. By aligning audience behavior with sales data, you can identify which content consistently attracts your most valuable customers. These insights not only enhance your content’s performance but also integrate seamlessly with storefront tools like UWidget.
For Shopify store owners, UWidget offers a simple way to connect YouTube engagement with on-site conversions. It embeds galleries, carousels, and sticky videos directly onto your storefront, creating a smoother buying experience. This is crucial, especially when 92% of marketers report seeing a positive ROI from video content.
As Michael Keenan puts it:
Data is a gift you shouldn't ignore. Otherwise, you're shooting in the dark every time, unaware of whether you're getting closer to or further away from your target.
Experiment with different video formats, optimize product tag placement using retention data, and keep refining your approach. With these strategies, you can turn YouTube insights into lasting e-commerce success.
FAQs
How can YouTube Analytics help optimize shoppable videos for better engagement and sales?
YouTube Analytics offers powerful insights into how your shoppable videos perform, tracking key metrics like watch time, audience retention, traffic sources, and demographics. These metrics let you pinpoint the most engaging parts of your videos, so you can strategically place product links and calls-to-action (CTAs) where they'll have the most impact.
The YouTube Shopping affiliate analytics tab takes it a step further, allowing you to track clicks, orders, and sales for each video. By diving into this data, you can experiment with elements like thumbnails, tags, and CTAs to fine-tune your approach, improve conversions, and drive more sales. Using these tools effectively helps ensure your videos connect with viewers while enhancing your e-commerce results.
What metrics should I track to improve the performance of shoppable videos on YouTube?
To get the most out of shoppable videos on YouTube, it's essential to keep an eye on key performance metrics that reveal how well your content is driving both engagement and sales. Here are some of the most important ones to track:
- View count and watch time/average view duration: These numbers show how many people are watching your content and how long they stay engaged. It's a great way to measure interest and retention.
- Engagement rate: Metrics like likes, comments, and shares help you see how actively viewers are interacting with your video.
- Click-through rate (CTR): This tracks how successful your video is at encouraging viewers to click through to your product pages.
- Conversion rate and average order value (AOV): These metrics reveal how effectively your video turns views into purchases and the average value of those purchases.
- Return on ad spend (ROAS): If you're running paid promotions, this helps you measure the profitability of your investment.
By consistently reviewing these metrics, you can adjust your content strategy to boost engagement and drive more sales for your e-commerce efforts.
How does UWidget help integrate YouTube videos into Shopify stores?
UWidget simplifies the process for Shopify merchants to feature YouTube videos on their stores - no coding required. Whether you want to add customizable galleries, carousels, sliders, sticky videos, Shorts, playlists, or subscribe cards, UWidget helps you create a dynamic, video-rich shopping experience.
By integrating UWidget, you can effortlessly showcase engaging video content that enhances customer interaction and encourages sales, all while keeping your store's design sleek and professional.