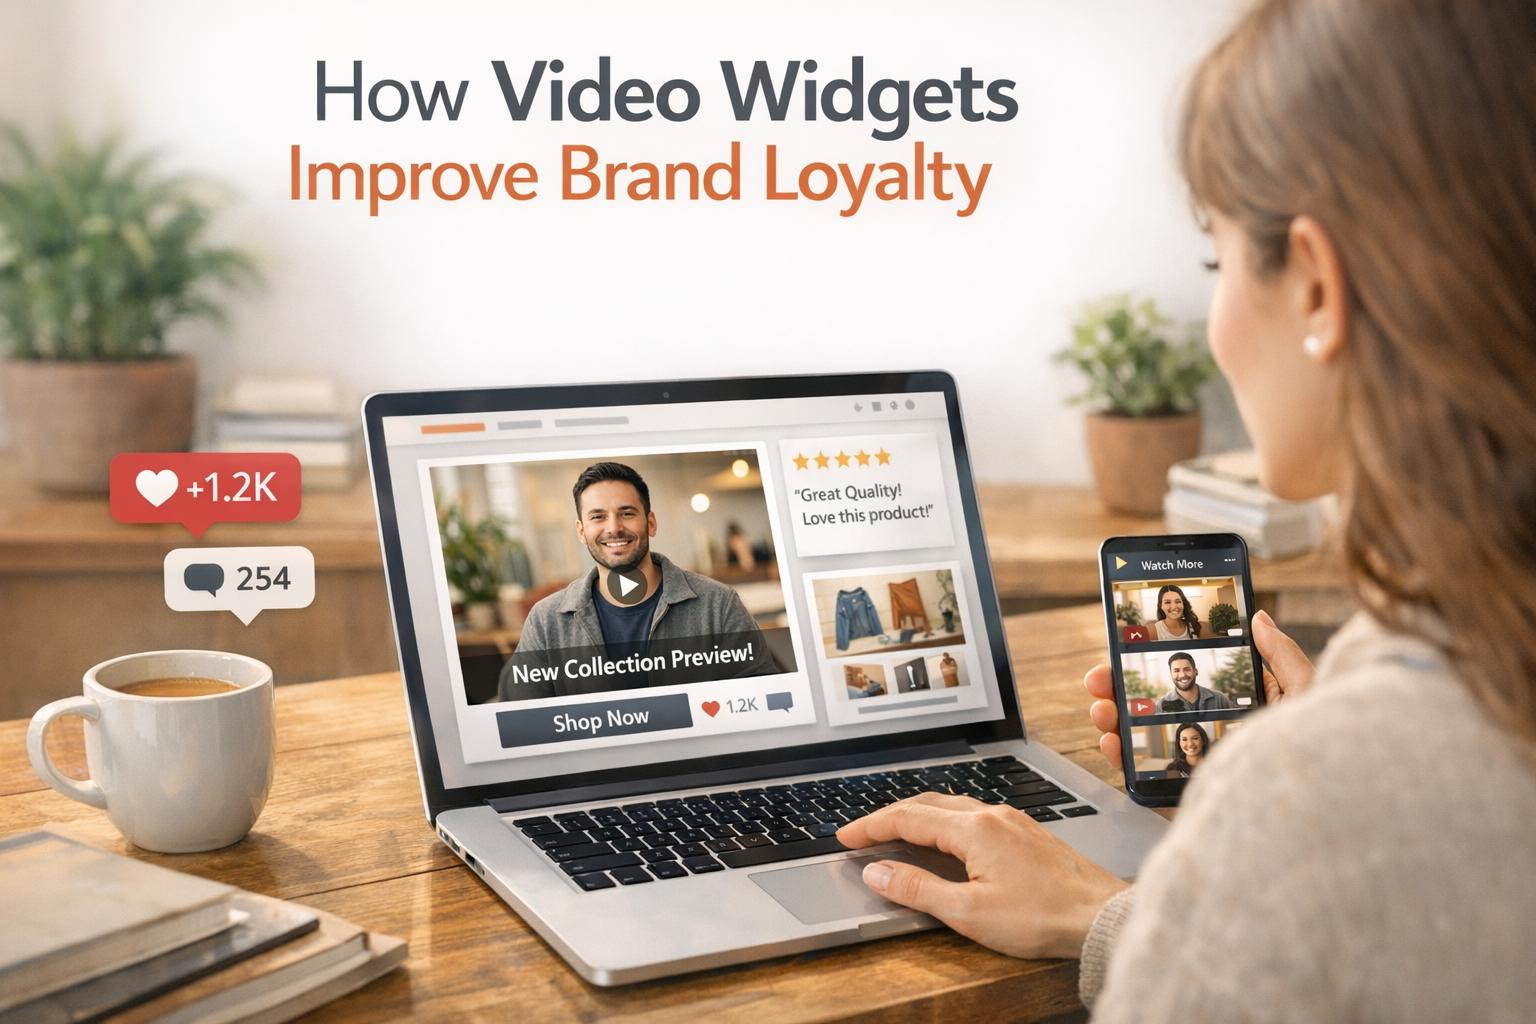
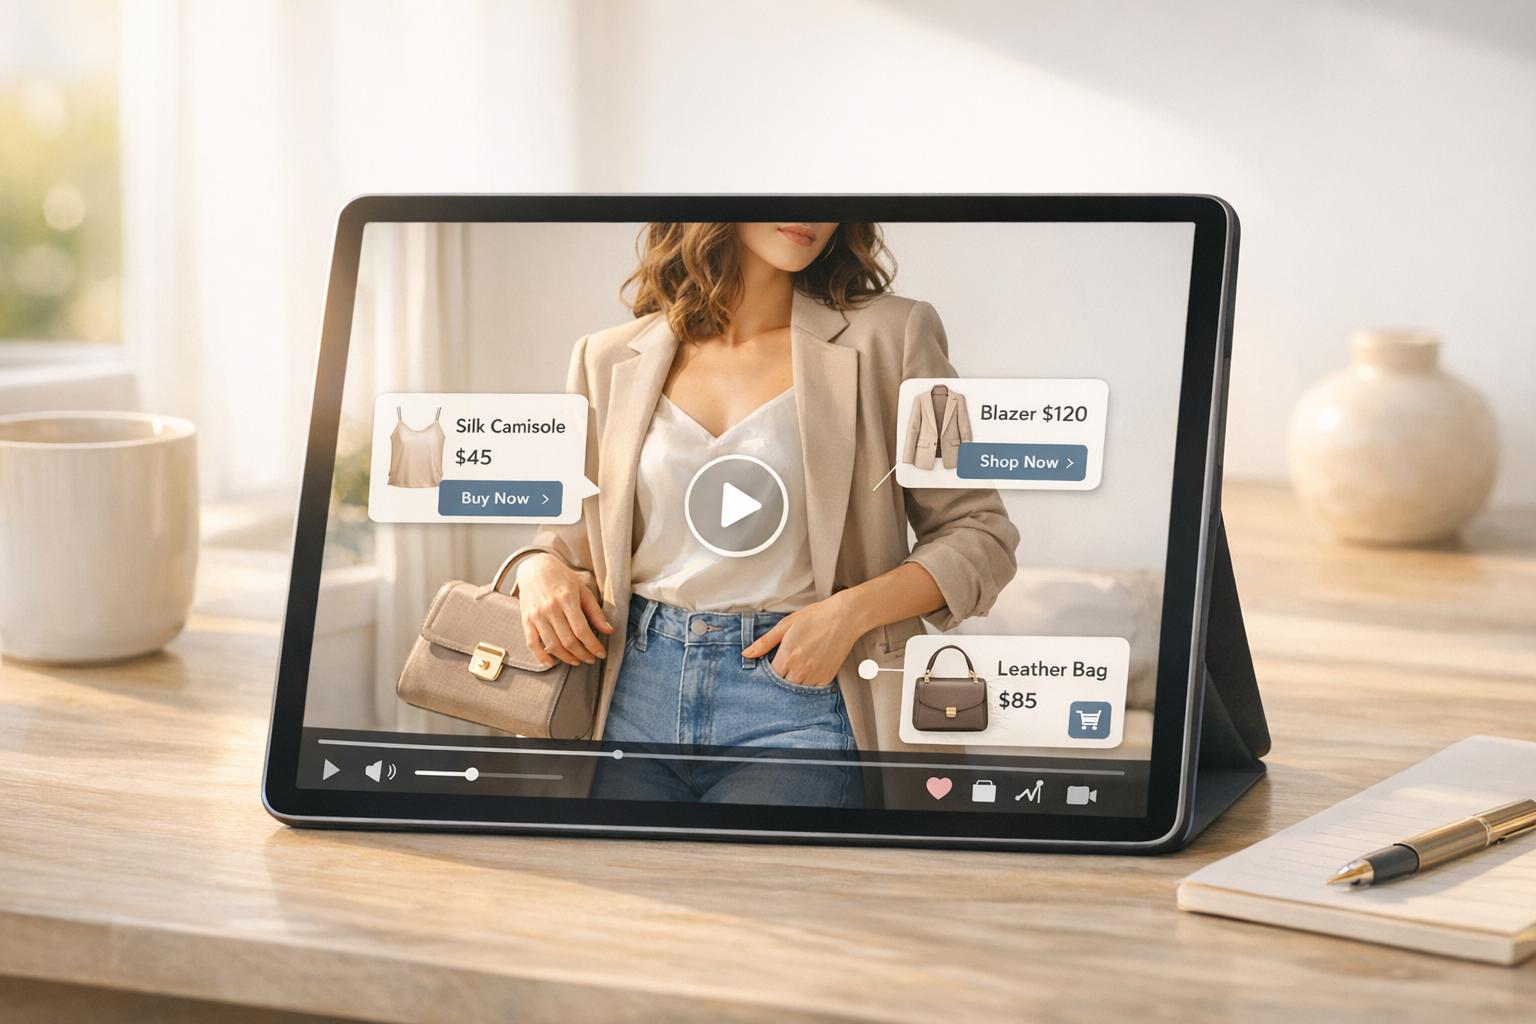
Shoppable videos are transforming e-commerce by letting viewers shop directly within video players. Measuring their success requires focusing on five key metrics:
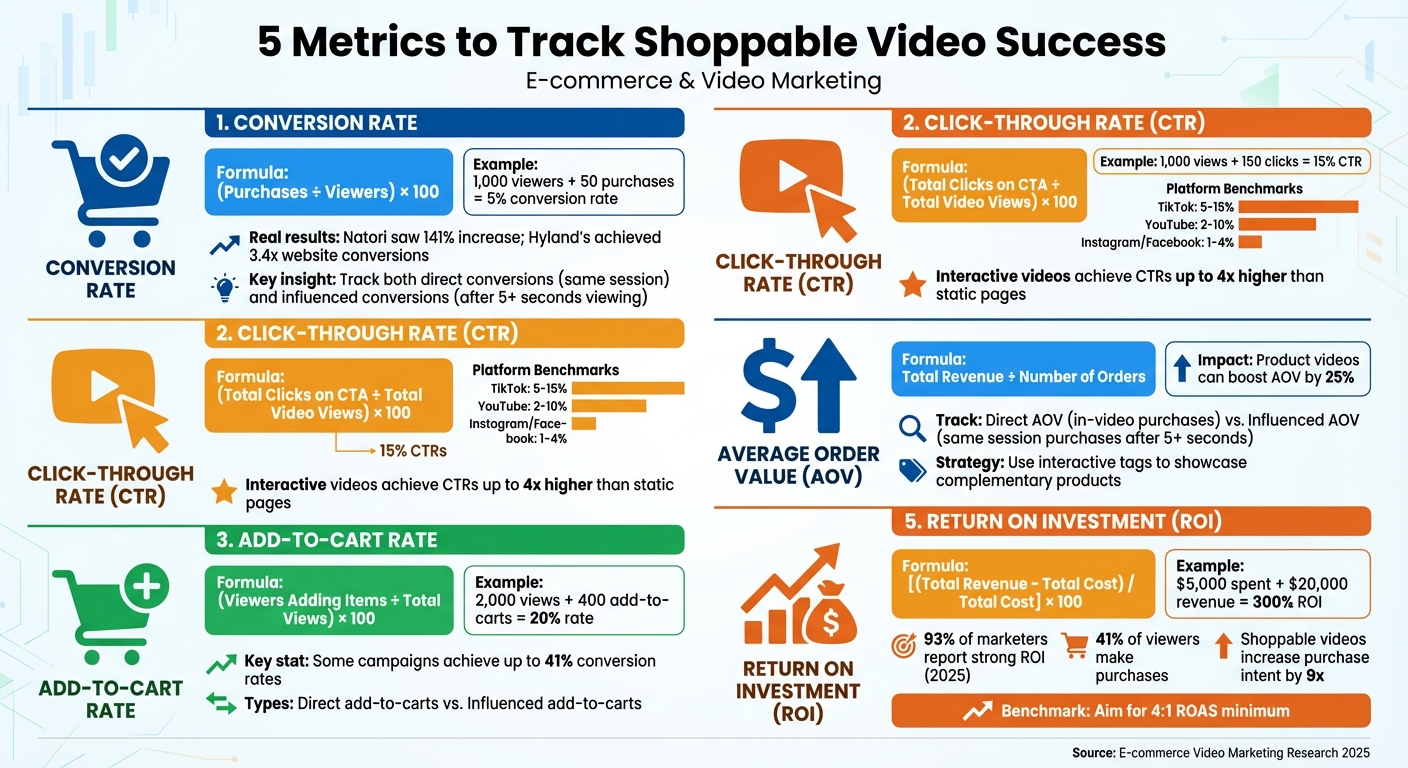
- Conversion Rate: Tracks the percentage of viewers who make a purchase after watching.
- Click-Through Rate (CTR): Measures how many viewers interact with clickable elements like product tags or CTAs.
- Add-to-Cart Rate: Shows how many viewers add products to their cart after watching.
- Average Order Value (AOV): Highlights the average spending per transaction influenced by the video.
- Return on Investment (ROI): Evaluates the revenue generated compared to campaign costs.
These metrics help businesses refine strategies, justify budgets, and improve performance. Tools like Videowise and UWidget simplify tracking and enhance insights, making it easier to optimize campaigns.
5 Key Metrics to Track Shoppable Video Success
Lively: Shoppable Videos, Stories, and Feeds to Improve Website Engagement
sbb-itb-d9e5b3a
1. Conversion Rate
The conversion rate tells you the percentage of viewers who go on to make a purchase after watching your shoppable videos. It’s a straightforward metric to gauge how effectively your videos are driving sales. The formula? (Purchases ÷ Viewers) × 100. For instance, if 1,000 people watch your video and 50 of them buy something, your conversion rate would be 5%.
When tracking conversions, there are two categories to keep in mind. Direct conversions happen when someone clicks on a product tag in your video, adds it to their cart, and completes the purchase in the same session. Influenced conversions, on the other hand, occur when someone watches your video for at least five seconds, then navigates your site and makes a purchase without using the video’s checkout feature. These distinctions are more than theoretical - they’re backed by real-world results.
Take Natori, for example. This luxury lingerie brand experienced a 141% jump in conversion rates after introducing shoppable video content. Similarly, Hyland’s saw website conversions increase by an impressive 3.4x after integrating user-generated video reviews into their strategy.
If your videos have high click-through rates but low conversions, the problem might lie elsewhere - like your product page or checkout process. To address this, try placing the video above the fold or simplifying your call-to-action buttons to make the process smoother. Even if the video doesn’t lead to an immediate sale, its impact can still drive purchases down the line.
2. Click-Through Rate (CTR)
Click-Through Rate (CTR) shows the percentage of viewers who engage with clickable elements in your shoppable video, such as product links, tags, or call-to-action (CTA) buttons. You can calculate it using this formula: (Total Clicks on CTA ÷ Total Video Views) × 100. For instance, if your video racks up 1,000 views and 150 people click the "Shop Now" button, the CTR would be 15%.
This metric gives you a clear picture of how well your CTAs are performing. A higher CTR means your CTAs are hitting the mark and your featured products are connecting with your audience. Essentially, it’s the bridge between someone passively watching your video and actively shopping.
When looking at benchmarks, CTRs can vary a lot depending on the platform. On TikTok, CTRs often fall between 5% and 15%, while YouTube averages 2% to 10%. Instagram and Facebook typically see lower CTRs, ranging from 1% to 4%. Interactive videos with in-video CTAs, however, can achieve CTRs up to four times higher than static landing pages.
To improve your CTR, try placing your clickable elements during the most engaging parts of your video instead of only at the end. Experiment with different button designs and text - like testing "Get Started" against "Learn More" - to see what resonates best. Most importantly, make sure the products you feature align with your audience’s interests and what they’re actively searching for.
3. Add-to-Cart Rate
The add-to-cart rate shows the percentage of viewers who add at least one item to their shopping cart after watching your shoppable video. It’s calculated using the formula: (viewers adding items ÷ total views) × 100. For instance, if a fashion brand’s shoppable video garners 2,000 views and 400 viewers add items to their carts, the add-to-cart rate would be 20%. This metric serves as an early indicator of viewer interest and commitment before they make a final purchase.
While clicks might reflect curiosity, adding an item to the cart indicates a stronger intent to buy. Shoppable videos have been shown to drive this intent, with some campaigns achieving conversion rates as high as 41%.
Monitoring your add-to-cart rate can also help uncover potential issues in the shopping journey. For example, if you see a high add-to-cart rate but low conversions, it might point to challenges during checkout. On the other hand, a low add-to-cart rate despite high video views could suggest that your messaging isn’t clearly conveying the product’s value.
Certain platforms even distinguish between two types of add-to-cart actions: direct add-to-carts (when viewers add items directly from the video) and influenced add-to-carts (when viewers watch the video but later add items via a product page). Tracking both can give you a fuller understanding of how your video influences shopping behavior.
To improve your add-to-cart rate, consider placing interactive product tags or "Add to Cart" buttons in areas of the video that naturally draw attention. Making it easy for viewers to add items without leaving the video can also enhance their experience and increase results. Next, let’s explore how Average Order Value can provide even more insight into video performance.
4. Average Order Value (AOV)
After understanding add-to-cart trends, it's time to dive into Average Order Value (AOV), which highlights how much customers are spending per transaction after engaging with your shoppable videos. Simply put, AOV is calculated by dividing the total revenue generated from video-driven purchases by the number of orders. This metric is key for determining whether your videos are inspiring shoppers to spend more.
Shoppable videos excel at encouraging higher spending by showcasing multiple products in one go. For instance, when viewers watch a product demo or tutorial, they’re often tempted to add complementary items directly through the video interface. What might have been a single-item purchase can quickly turn into a multi-item order. A higher AOV is a strong indicator that your video content is encouraging customers to spend more. Research even shows that product videos led by experts can boost AOV by as much as 25%.
To get the full picture, track two types of AOV: direct AOV (purchases completed directly within the video player) and influenced AOV (purchases made later in the same session by viewers who watched at least 5 seconds of the video). This breakdown helps you understand whether your videos are driving immediate impulse buys or building trust that leads to higher-value purchases.
You can also compare your video-driven AOV to your store’s overall average to measure the impact of your video content. Segmenting AOV by video type - like tutorials, unboxings, or brand stories - can reveal which formats are most effective at driving bigger transactions.
Looking to increase AOV through shoppable videos? Try interactive product tags to highlight related items in a single video, making cross-selling easier. Another strategy is setting free shipping thresholds about 30% higher than your current AOV, encouraging customers to add more to their carts to qualify.
5. Return on Investment (ROI)
After analyzing Average Order Value (AOV), the next step is to evaluate Return on Investment (ROI) - a key metric that reveals the financial success of your shoppable video campaigns. Simply put, ROI measures how much revenue your videos generate compared to the costs of creating and promoting them. The formula is straightforward:
ROI (%) = [(Total Revenue - Total Cost) / Total Cost] × 100.
For example, if you spend $5,000 on a campaign and it generates $20,000 in revenue, your ROI is 300%. While this calculation provides a quick overview, digging deeper into both costs and revenues will give you a more complete picture.
To ensure accuracy, include all relevant costs, such as production expenses, promotion budgets, and platform fees. On the revenue side, track not only direct sales - purchases made directly through the video interface - but also influenced sales, where viewers who watched at least 5 seconds of your video complete a purchase during the same session.
Here are some numbers to keep in mind:
- 93% of marketers reported strong ROI from video marketing in 2025.
- Shoppable videos can increase purchase intent by up to 9 times compared to static content.
- Around 41% of viewers who engage with shoppable videos end up making a purchase.
A good benchmark to aim for is a ROAS (Return on Ad Spend) of at least 4:1, meaning $4 in revenue for every $1 spent.
To refine your ROI tracking, use UTM parameters in your video links. These allow you to pinpoint which videos are driving traffic and conversions in tools like Google Analytics. Additionally, choose an attribution model - either single-touch or multi-touch - that aligns with your business goals. Beyond immediate sales, consider long-term benefits, such as improved customer retention and increased social media shares, to fully capture the ripple effects of your shoppable videos.
"Tracking ROI is essential for assessing the financial success of shoppable video campaigns. It provides a clear picture of whether the revenue generated from video-driven sales justifies the expenses incurred in creating and distributing the videos."
- Team Storyly
Tools for Tracking Video Metrics
When it comes to understanding how videos impact your business, having the right tools is crucial. While platforms like Shopify Analytics provide basic insights into traffic and sales, they often fall short in revealing how videos directly influence purchasing behavior. That's where specialized tools like Videowise come into play. Videowise offers advanced tracking capabilities, such as differentiating between "influenced" revenue (purchases made after watching at least 5 seconds of a video) and "direct" revenue (transactions completed within the video player itself).
For merchants using YouTube content, UWidget simplifies the process of creating shoppable video galleries, carousels, and sticky players - all without needing any coding skills. By simply pasting a YouTube URL, you can tag products directly within the videos, allowing customers to watch and shop seamlessly. UWidget has earned a perfect 5/5 rating on the Shopify App Store and starts at just $5.99 per month.
To dive even deeper, integrate your video platform with Google Analytics using UTM parameters. This helps identify which videos are driving traffic and conversions. Platforms like Firework can link with robust analytics suites such as Adobe Analytics, offering a full view of the conversion funnel. Meanwhile, tools like Socialinsider provide cross-platform comparisons and competitive benchmarks. These integrations enable businesses to generate detailed reports and establish performance benchmarks.
The best tools deliver granular data, breaking it down by video, widget, page, and shopper behavior. For example, Videowise, trusted by over 4,000 brands, offers automated weekly or monthly reports. Their impact is clear: SOSU Cosmetics saw an 8% increase in average order value (AOV) and generated over $750,000 in revenue with a 9.9% conversion rate. Similarly, Apolla leveraged the platform to drive $170,000 in sales with a 10.8% conversion rate.
"The ability to provide short format, shoppable videos is a game changer. Our retention rate skyrocketed... the ability to buy the product after watching a few videos is genius and frictionless."
- Peter Lobanov, Growth Strategist, GelBlaster
Conclusion
Keeping track of metrics like conversion rate, CTR, add-to-cart rate, AOV, and ROI turns shoppable videos into powerful tools for driving revenue. These numbers help you understand what works, making it easier to justify your marketing budget to decision-makers while showcasing a clear financial impact.
The stats speak for themselves: by 2025, 93% of marketers reported seeing strong ROI from video marketing, and 81% of consumers made a purchase or downloaded an app after watching a video. By analyzing performance data, you can identify where potential customers drop off, refine campaigns, and focus resources on strategies that deliver the best results. Real-time insights, like retention graphs or A/B testing for calls-to-action, allow you to fine-tune your content based on actual viewer behavior, leading to continuous improvements.
For those looking to take it a step further, smart tools make all the difference. Shopify merchants, for example, can use UWidget to create shoppable video galleries with direct product tagging. It integrates effortlessly with Google Analytics through UTM parameters, and at just $5.99/month, it boasts a perfect 5/5 rating.
FAQs
What are the best ways to improve the conversion rate of shoppable videos?
To make your shoppable videos more effective at driving conversions, think of them as a mini sales funnel and focus on the metrics that matter most. Start by monitoring the conversion rate - this tells you how many viewers actually make a purchase after interacting with your video. Other key metrics to keep an eye on include click-through rates on product tags, average watch time, and checkout completion rates. These numbers can reveal where viewers lose interest, helping you fine-tune your videos for better results.
Want to see those conversions climb? Start with a clear and persuasive "Buy Now" call-to-action on your product tags. Simplify the checkout process so it’s fast and hassle-free. Adding interactive elements, like wishlist options or like buttons, can also encourage viewers to stay engaged. Since many viewers will be watching on their phones, make sure your videos are mobile-friendly and load quickly - slow-loading videos can hurt both watch time and purchase intent.
Personalization is another game-changer. Tailor product recommendations based on the viewer’s behavior to make them feel like the video was made just for them. And don’t forget to experiment: test different video lengths, thumbnail designs, and the placement of product tags to see what resonates most. Tools like Fractal Apps’ UWidget, ILikeThat, and CheckIt can help you create a smoother, more engaging shopping experience, ultimately driving higher conversions.
What are the best ways to measure the success of shoppable videos?
To gauge how well your shoppable videos are performing, it’s essential to use tools that offer detailed analytics and practical insights. Look for platforms tailored to track video performance, user engagement, and conversion rates. These tools can help you monitor crucial metrics like click-through rates, purchase conversions, and viewer retention.
With the help of these analytics, you’ll gain a clearer picture of how your videos are influencing results. This information makes it easier to fine-tune your content and get the most out of your investment.
What is the role of Average Order Value (AOV) in measuring the success of shoppable videos?
Average Order Value (AOV) is a crucial metric for measuring the effectiveness of shoppable videos. It reveals how much revenue each purchase brings in. When your AOV is higher, it’s a sign that viewers are not just interacting with your content but are also spending more per transaction - directly contributing to greater profitability.
What’s even better? Boosting AOV through shoppable videos improves your return on investment (ROI) without depending entirely on gaining new customers. This makes them an excellent strategy for driving consistent and long-term growth.