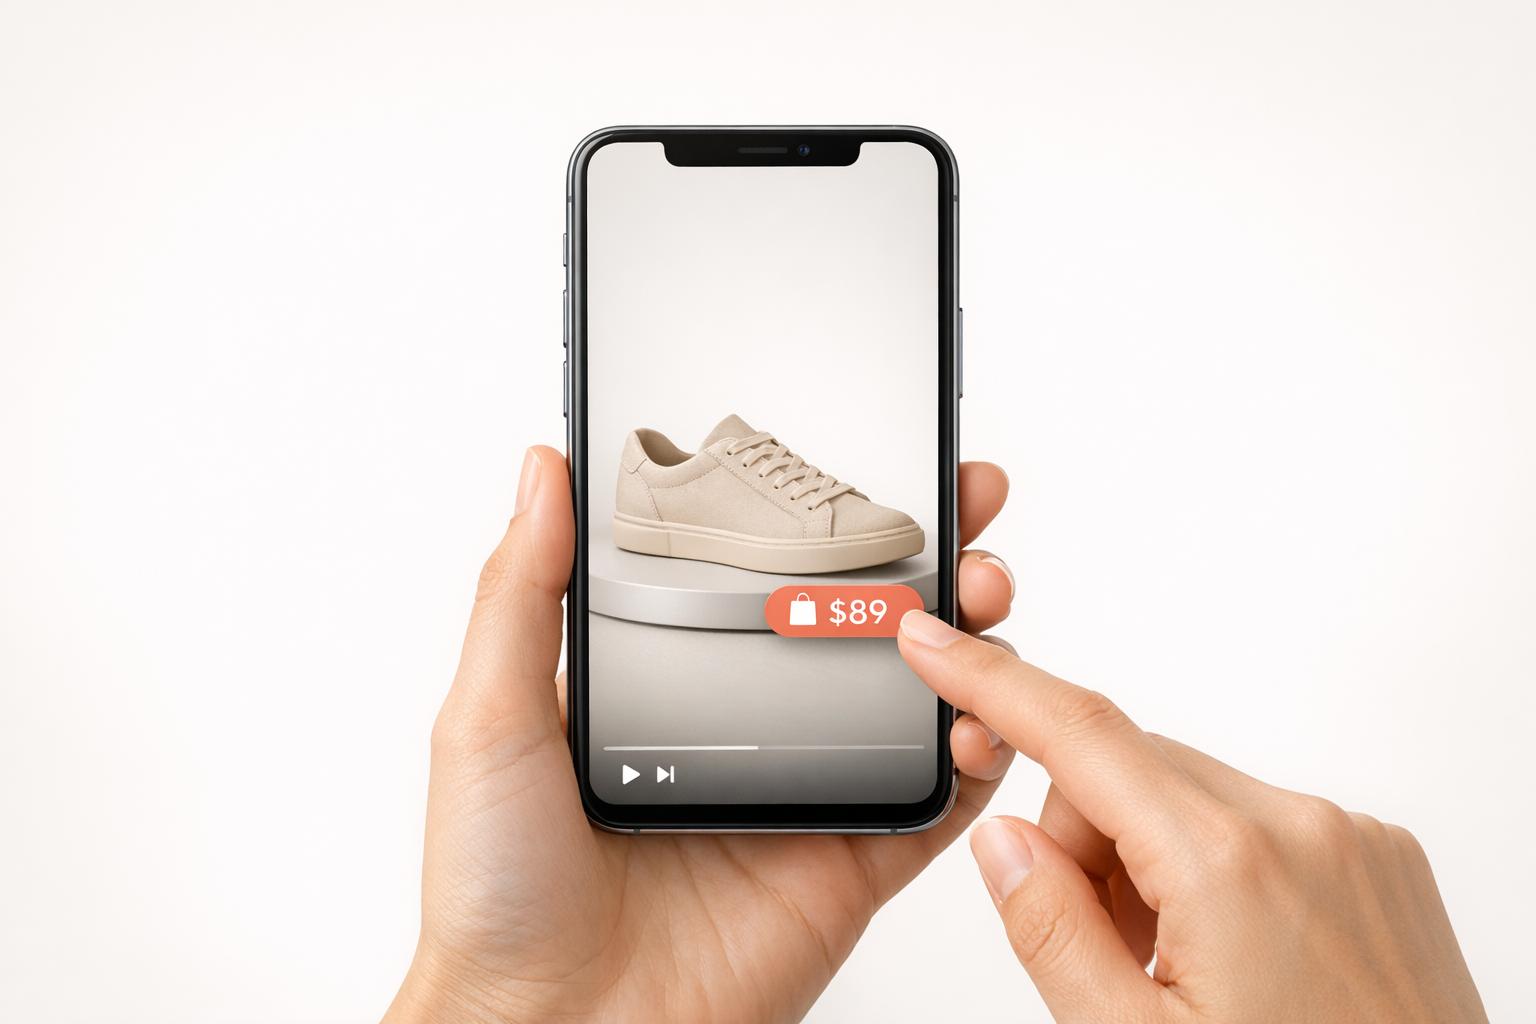
Shoppable videos are transforming how people shop online by embedding interactive features like clickable product links directly into videos. These videos not only simplify purchasing but also deliver impressive results:
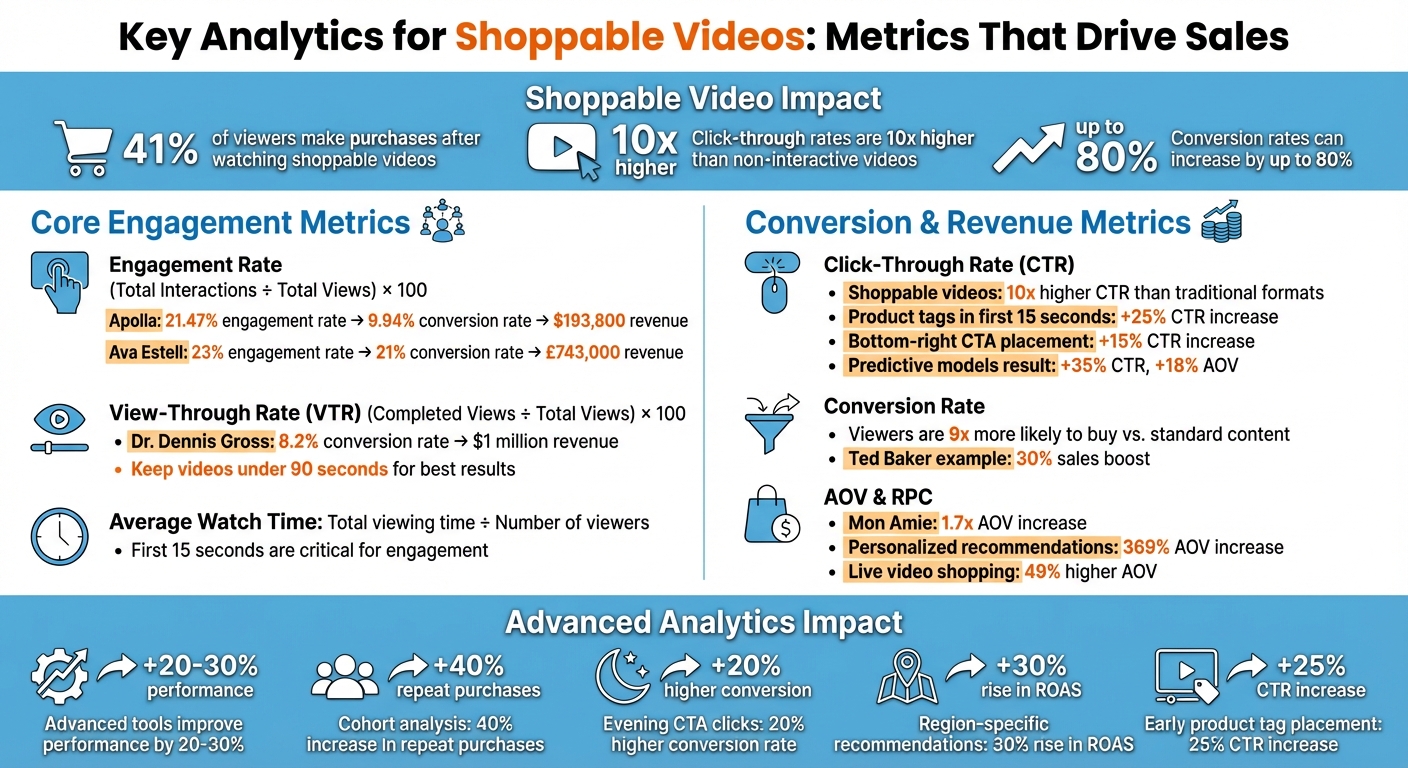
- 41% of viewers make purchases after watching shoppable videos.
- Click-through rates are 10x higher than non-interactive videos.
- Conversion rates can increase by up to 80%.
To maximize their impact, tracking the right metrics is critical. Key performance indicators include:
- Engagement Rate: Measures viewer interactions like clicks on product tags or CTAs.
- View-Through Rate (VTR): Tracks how many viewers watch most or all of a video.
- Average Watch Time: Shows how long viewers stay engaged.
- Click-Through Rate (CTR): Indicates how effectively CTAs drive clicks.
- Conversion Rate: The percentage of viewers who make purchases.
Advanced tools like cohort analysis, heatmaps, and predictive analytics further refine strategies, helping businesses identify drop-off points and improve performance by up to 30%. Shopify apps like UWidget and ILikeThat simplify integration and tracking, enabling merchants to turn videos into powerful sales tools.
Shoppable videos are not just engaging - they’re a proven way to drive higher sales, improve conversion rates, and increase average order value.
Key Shoppable Video Analytics Metrics and Performance Statistics
Shopify Analytics Tutorial to Boost Sales with Julia from Shopify Success
Core Engagement Metrics for Shoppable Videos
Understanding how viewers interact with your shoppable videos is essential. Metrics like engagement rate, view-through rate (VTR), and average watch time offer valuable insights into viewer behavior. Let’s break down these key metrics to see how they can guide your strategy.
Engagement Rate
Engagement rate tracks how actively viewers interact with your video. Actions like clicking product tags, expanding details, adding items to the cart, or even participating in polls all count. The formula is simple: (Total Interactions ÷ Total Views) × 100.
For example, Apolla, a compression sock brand, used shoppable tutorials after appearing on Shark Tank to achieve a 21.47% engagement rate, leading to a 9.94% conversion rate and over $193,800 in revenue. Similarly, Ava Estell streamlined their customer journey with shoppable videos, hitting a 23% engagement rate and a 21% conversion rate, generating £743,000 in additional revenue.
To boost engagement, use personalized CTAs, which can improve conversions by 202%. Place them in the bottom-right corner for a 15% higher click-through rate (CTR). Remember, the first 15 seconds are critical - this is when viewer attention peaks, so make sure to front-load your product tags and interactive elements.
View-Through Rate (VTR)
VTR measures how many viewers stick with your video until the end - or at least to a significant point, like 75% of its duration. The formula: (Completed Views ÷ Total Views) × 100. A high VTR means your content keeps viewers engaged, while a low VTR highlights where viewers lose interest.
Dr. Dennis Gross, a skincare brand, used VTR as part of their strategy, achieving an 8.2% conversion rate and generating $1 million in revenue. A strong VTR often correlates with higher conversions.
To improve VTR, keep your videos under 90 seconds. If you notice drop-off points, use tools like heatmaps or funnel visualizations to identify problem areas and refine those segments. Since most viewers watch on mobile devices, optimize for vertical (9:16) formats and ensure tap targets are easy to use.
Average Watch Time
Average watch time reveals how long viewers stay engaged with your video. Calculate it by dividing the total viewing time by the number of viewers. This metric can help you identify "dead zones" in your content - moments where viewers lose interest and stop watching.
If your average watch time is high, it’s a good sign that your content resonates with viewers and strengthens their connection to your brand. To further extend engagement, try adding interactive elements like polls or clickable tags. However, if watch time is high but clicks are low, consider repositioning your CTAs earlier in the video or adjusting their design for better visibility.
Conversion and Revenue Metrics
Engagement metrics show how viewers interact with your content, but conversion and revenue metrics tell you the real story - how your shoppable videos are driving sales and delivering a return on investment.
Click-Through Rate (CTR)
Click-Through Rate (CTR) measures the percentage of viewers who click on a call-to-action (CTA) or embedded product link in your video. It’s the key indicator of how effectively your interactive elements grab attention and guide viewers toward a purchase. Shoppable videos often outperform traditional formats, with CTRs up to 10x higher. For instance, placing product tags within the first 15 seconds can increase CTR by 25%, while moving CTAs from the center to the bottom-right corner boosts CTR by 15%. A clothing retailer using predictive models saw a 35% jump in CTR and an 18% rise in average order value (AOV).
If your videos have high views but low CTR, it’s time to tweak your strategy. Experiment with the timing, placement, and visibility of your shopping elements. Use clear, action-oriented language in CTAs, and make sure they’re visible throughout the video without interrupting the story.
Once viewers click, the next critical step is turning that interest into action - measured by your conversion rate.
Conversion Rate
Conversion rate measures the percentage of viewers who make a purchase after engaging with your video. It’s the ultimate measure of success for shoppable videos. Research shows that viewers of shoppable videos are 9x more likely to buy compared to those watching standard content.
"Tracking shoppable video performance goes beyond simply counting views - it's essential for proving ROI."
– Natalia Petrova, Video Marketer
A great example of this is Ted Baker’s shoppable sitcom, Keeping Up with the Bakers. This interactive, 360-degree video allowed viewers to click on characters’ outfits to shop directly, resulting in a 30% sales boost.
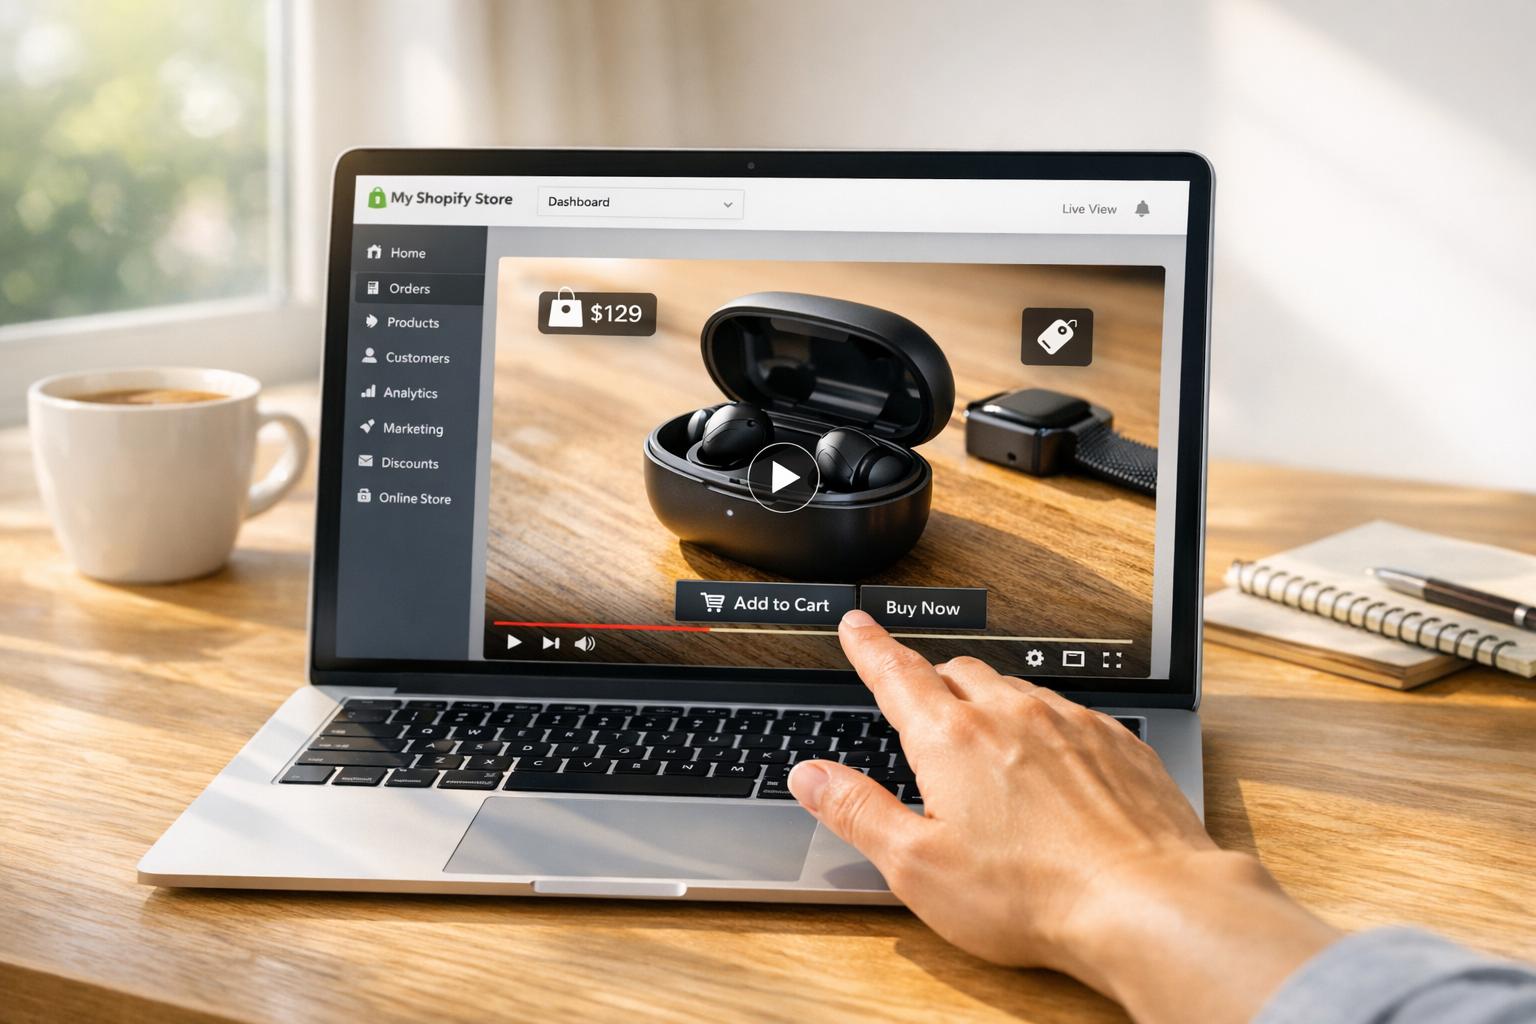
To improve conversion rates, focus on the first 15 seconds of your video when attention is at its peak. You can also use urgency-driven tactics like countdown timers or “limited time offer” messages to encourage immediate action. Embedding "Add to Cart" or "Buy Now" buttons directly within the video player eliminates unnecessary steps, making the purchase process seamless.
Beyond just tracking conversions, you’ll want to dive deeper into metrics like Average Order Value (AOV) and Revenue Per Click (RPC) to understand the profitability of your strategy.
Average Order Value (AOV) and Revenue Per Click (RPC)
Average Order Value (AOV) shows the average amount spent per transaction, helping you see whether your videos are encouraging larger purchases or multiple-item orders. Revenue Per Click (RPC), on the other hand, measures how much revenue each click generates, offering insight into how well your CTAs and pricing strategies are working.
In 2023, Mon Amie Online Store boosted their AOV by 1.7x by incorporating personalized product recommendations and complementary items into their shoppable videos. Sessions with personalized recommendations led to a 369% increase in AOV compared to those without.
| Metric | What It Measures | Revenue Insight |
|---|---|---|
| Conversion Rate | % of viewers who buy after watching | Shows how effectively the video drives sales. |
| Revenue Per Click (RPC) | Revenue generated per CTA click | Assesses profitability and pricing strategy. |
| Average Order Value (AOV) | Average $ spent per transaction | Reflects success in upselling and cross-selling. |
If your engagement is high but RPC is low, it might be time to rethink your pricing or bundling strategies. Offering bundles with discounts of 45% or more directly within the video can help boost AOV. Live video shopping, with its real-time interaction, also creates opportunities to increase revenue, driving 49% higher AOV compared to pre-recorded content.
"A higher AOV means more revenue without necessarily acquiring more customers - you're simply getting more value from each visitor."
– Firework
sbb-itb-d9e5b3a
Advanced Analytics Strategies for Shoppable Videos
Advanced analytics can help you understand why viewers behave the way they do and even predict their future actions. These strategies have been shown to improve the performance of shoppable videos by 20–30%.
Cohort Analysis and Audience Segmentation
Cohort analysis groups viewers based on shared traits - like the first time they watched your video or the device they used - to uncover hidden behavior patterns. For example, a beauty brand used this method to identify groups with specific product interests. By tailoring content to these segments, they saw a 40% increase in repeat purchases. Adjusting video formats for mobile, such as adopting vertical (9:16) layouts, also enhances engagement.
Audience segmentation takes things up a notch by customizing content based on factors like demographics, browsing history, or past purchases. One retailer discovered that viewers who clicked calls-to-action in the evening had a 20% higher conversion rate. Using insights like this, you can refine your posting schedule to target peak times for specific segments. These strategies, paired with predictive analytics and funnel visualizations, offer even deeper insights into viewer behavior.
Predictive Analytics and Funnel Visualizations
Predictive analytics goes beyond simple segmentation by using historical data and algorithms to forecast video performance before full-scale promotion. Retailers using predictive models have achieved up to a 35% increase in click-through rates and an 18% boost in average order value. Region-specific recommendations have also led to a 30% rise in return on ad spend.
Funnel visualizations provide a detailed map of the shopper’s journey - from the first view to the final purchase. This helps identify exactly where viewers drop off. For instance, if viewers abandon the process after clicking a product tag, the issue might be with the landing page rather than the video itself. Breaking down this data by device, audience, or location can reveal performance insights that aggregated data might miss.
Heatmaps for Interaction Insights
Heatmaps offer a frame-by-frame analysis of viewer behavior, showing where users pause, rewatch, skip, or drop off. These tools help you identify which segments are engaging and which need improvement. For example, a beauty brand found that product tags placed earlier in videos outperformed those placed later, resulting in a 25% increase in click-through rates.
"If you know the types of videos that drive higher engagement, what is making viewers lose interest in the video, what content in your videos viewers keep coming back to... you can identify the weak links in your videos [and] optimize those weak links."
– Shanaz Khan, Brand Marketer, VWO
Heatmaps also let you track specific interactions, like clicks on calls-to-action or product links, and compare the behavior of converting versus non-converting viewers. If viewers frequently rewatch a particular segment, you might want to replicate that hook or emphasize that product feature in future videos. These insights guide you in refining your content, ensuring stronger engagement in the next iteration.
Using Shopify Tools for Analytics Integration
Shopify merchants have access to specialized apps that seamlessly connect store analytics with video engagement data. Here's a closer look at some Shopify apps designed to simplify and improve analytics integration.
Embedding Videos with UWidget
UWidget makes it easy for merchants to embed YouTube videos, Shorts, and playlists by simply entering the video URL. With various layout options, it offers flexibility in how content is displayed. The app also tracks user engagement, providing insights into how customers interact with videos across different formats.
One standout feature is its ability to tag products directly in videos. This allows shoppers to click on tagged items and make purchases instantly. The app tracks both direct sales (purchases made directly from the video) and influenced sales (where viewers watch at least 5 seconds of video before buying). To ensure speed and responsiveness, UWidget employs thumbnail-first widgets and lazy loading, optimizing site performance for mobile users.
"From YouTube's perspective, watch time, or the estimated total minutes spent viewing your content, is more important than a raw view." – Michael Keenan, Shopify
UWidget offers tiered pricing plans and includes a 7-day free trial, making it a flexible option for businesses of all sizes.
Increasing Conversions with ILikeThat and CheckIt
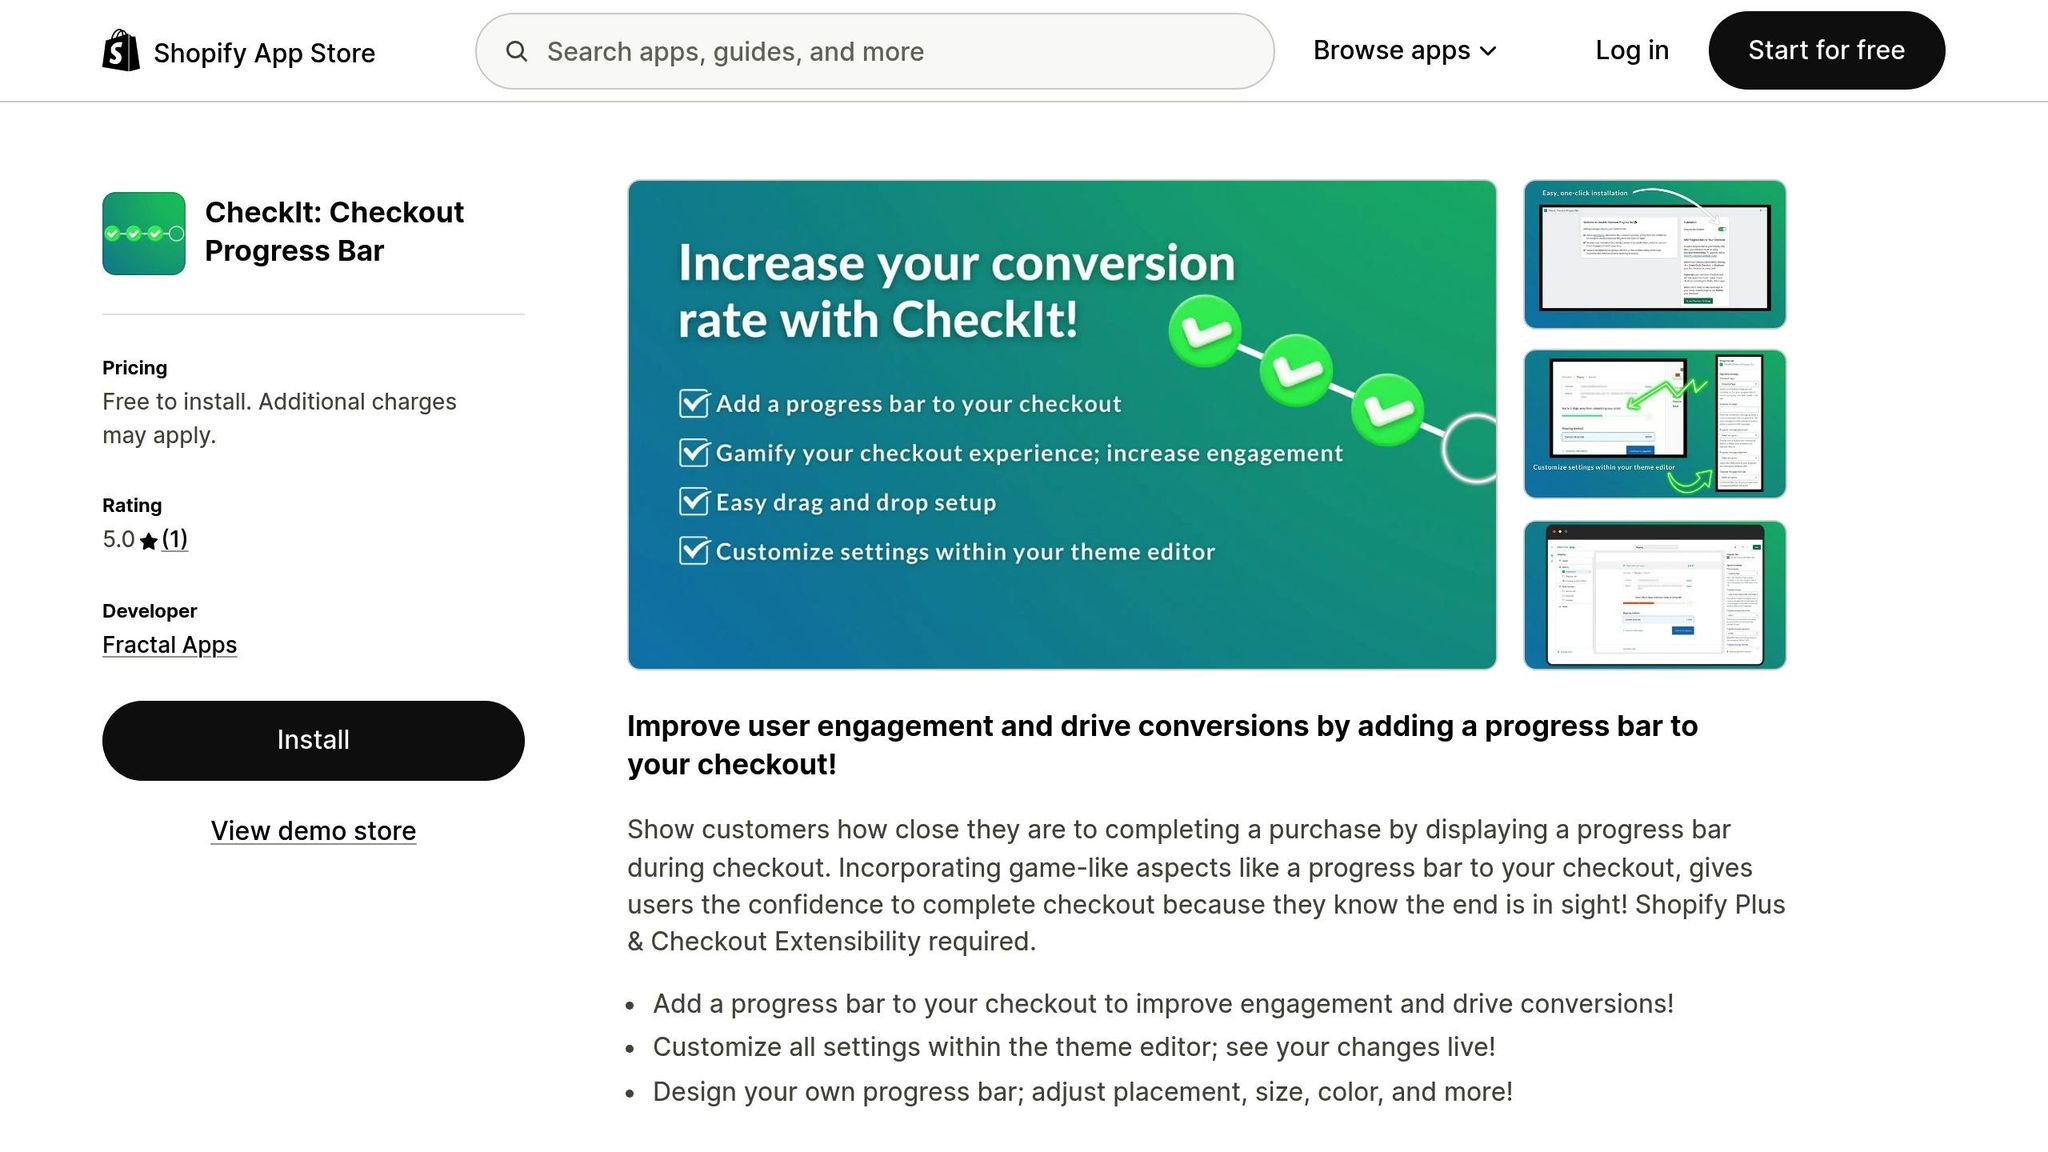
Beyond embedding videos, tools like ILikeThat and CheckIt focus on driving conversions. ILikeThat adds "like" buttons to videos, helping merchants gauge audience sentiment and identify popular products. Meanwhile, CheckIt simplifies the checkout process by displaying a progress bar, reducing friction and improving completion rates.
Organizing Content with DivideItUp and Time2Read
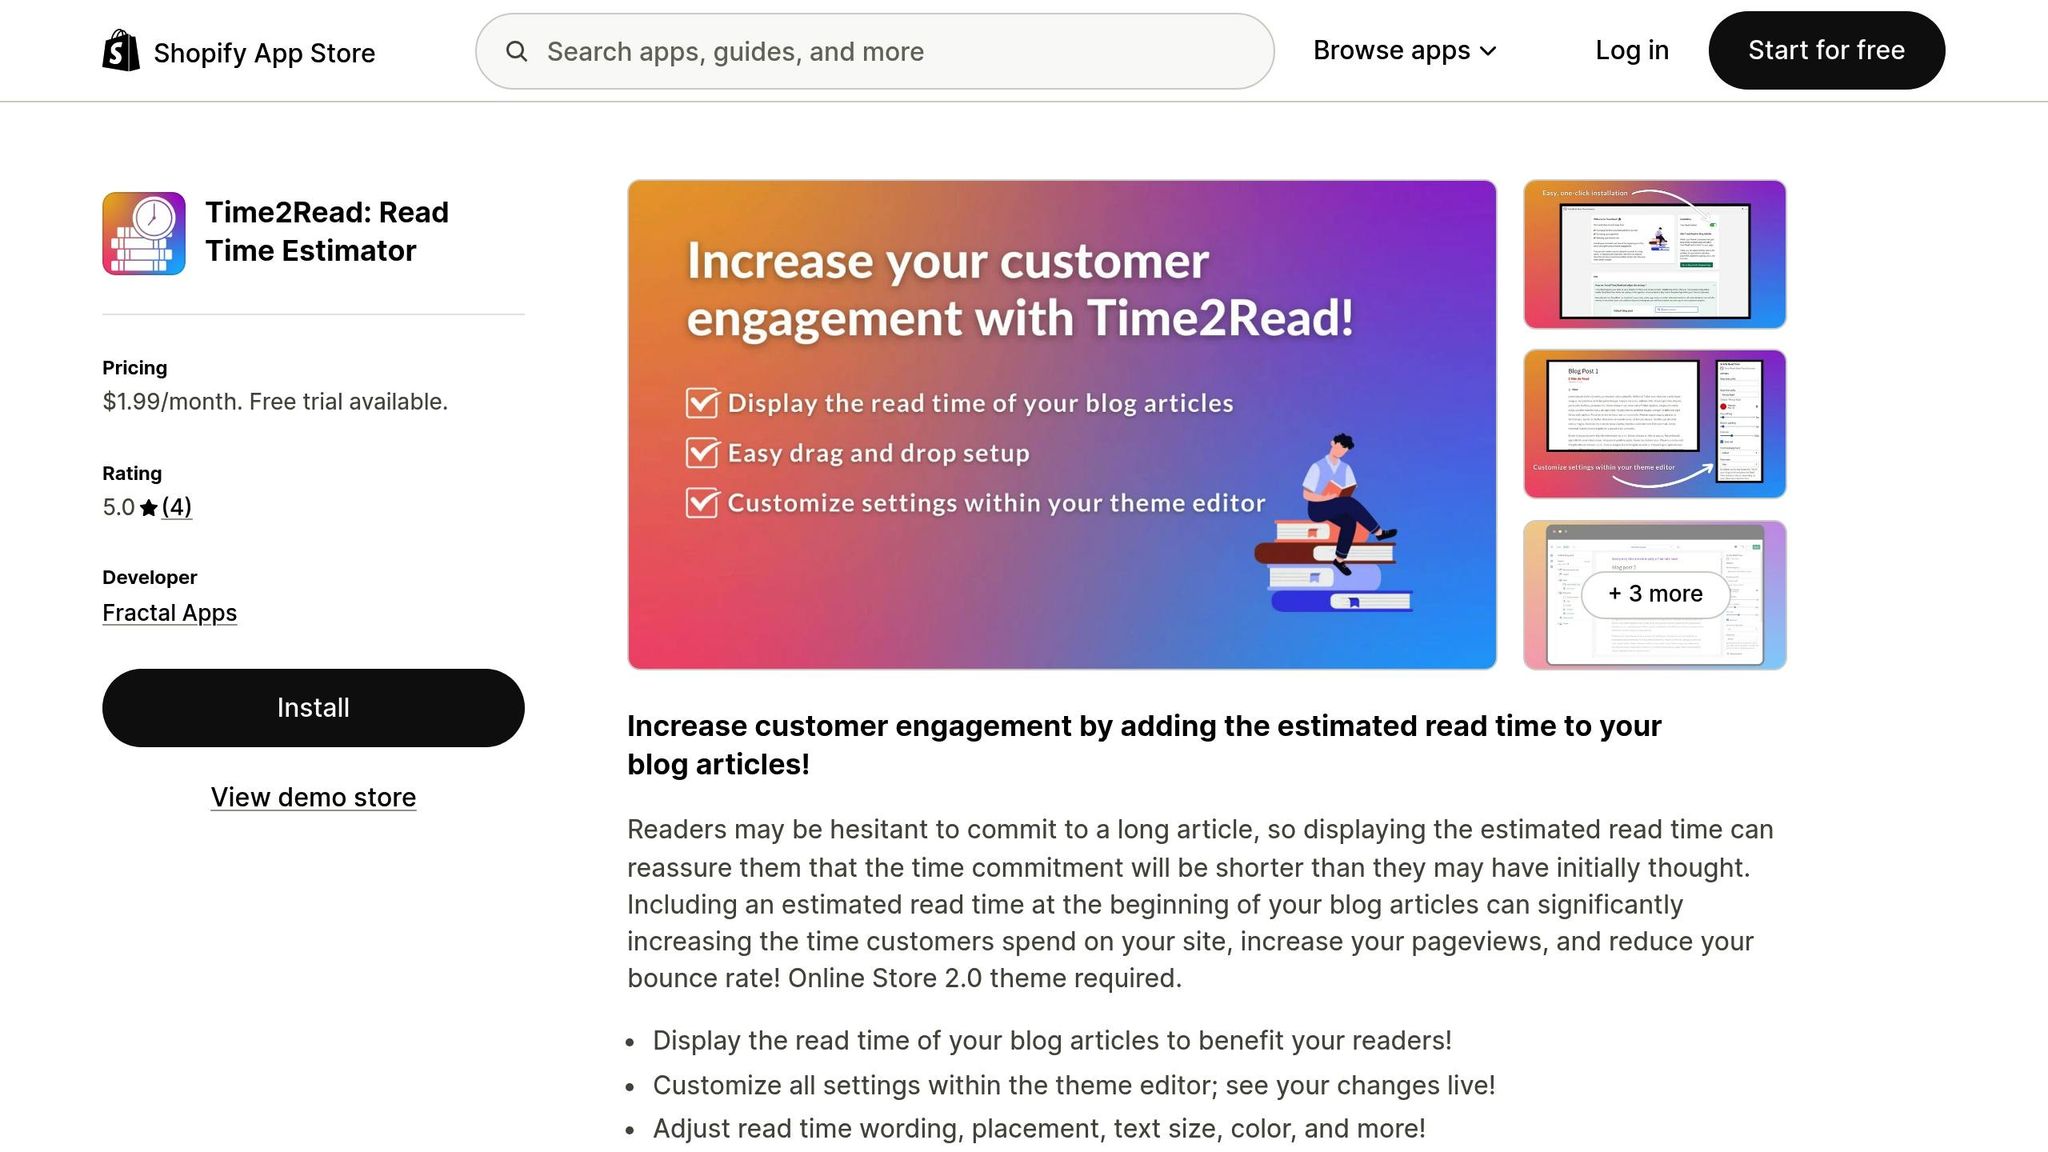
DivideItUp and Time2Read enhance user experience by organizing content effectively and setting clear reading expectations. These tools not only improve engagement but also help reduce bounce rates, creating a smoother, more enjoyable shopping experience. Together, they simplify analytics and elevate the impact of shoppable videos, turning insights into actionable results.
Conclusion
Using detailed analytics can turn viewer interactions into measurable sales. To make the most out of shoppable videos, it’s crucial to monitor the right metrics throughout the customer journey. Engagement metrics like view-through rate and average watch time help you understand if your content is connecting with viewers, while conversion metrics such as click-through rate and conversion rate show how well your videos are driving purchases. Earlier, we saw how advanced tools like cohort analysis and predictive modeling can improve shoppable video performance by 20–30%, helping identify valuable customer groups and predict future returns.
Shoppable videos have proven to outperform static content in driving conversions. They can increase conversion rates by up to 80%, while interactive videos often achieve click-through rates 10 times higher than passive formats. This presents a significant opportunity for Shopify merchants.
Apps like UWidget make it easy to turn YouTube videos and Shorts into shoppable experiences by adding direct product tags. These tools also track both direct and influenced sales, ensuring accurate attribution. Combined with other apps like ILikeThat, CheckIt, DivideItUp, and Time2Read, merchants can create a smooth journey from product discovery to purchase.
FAQs
How do shoppable videos help boost sales and conversions?
Shoppable videos are a game-changer for driving sales and improving conversion rates. They let viewers interact with products directly inside the video using clickable links, product tags, or pop-ups. This makes it incredibly convenient for customers to shop without ever leaving the content.
By simplifying the buying process, these videos cut down decision-making time and encourage impulse purchases. The result? Higher conversion rates and a noticeable boost in overall sales.
What are the key metrics to measure the success of shoppable videos?
To gauge how well your shoppable videos are performing, keep an eye on these important metrics:
- Engagement rates: Look at the number of views, clicks, and interactions to see how viewers are responding to your videos.
- Conversion rates: Check how many viewers go on to make a purchase after watching the video.
- Sales impact: Measure the revenue generated directly from your shoppable videos to understand their contribution to your bottom line.
- Session duration: Review how long viewers stay on your site after engaging with the video.
- Return on investment (ROI): Assess the overall profitability of your shoppable video campaigns to ensure they're worth the investment.
Tracking these metrics helps you fine-tune your videos, connect better with your audience, and drive more sales.
What are the best ways to boost engagement with shoppable videos?
To make shoppable videos more engaging, businesses should aim for smooth, interactive experiences. One effective approach is linking platforms like YouTube with your Shopify store. This allows for product tagging and in-video shopping, making it easier for viewers to shop directly from the video. Keep an eye on metrics like watch time, audience retention, and conversion rates - these will help you understand how viewers interact with your content and where improvements are needed.
Adding interactive features such as clickable hotspots, clear calls-to-action, and product highlights can prompt viewers to make quick purchasing decisions. Regularly reviewing performance data and tweaking your approach based on those insights can lead to a more captivating and profitable shoppable video strategy.