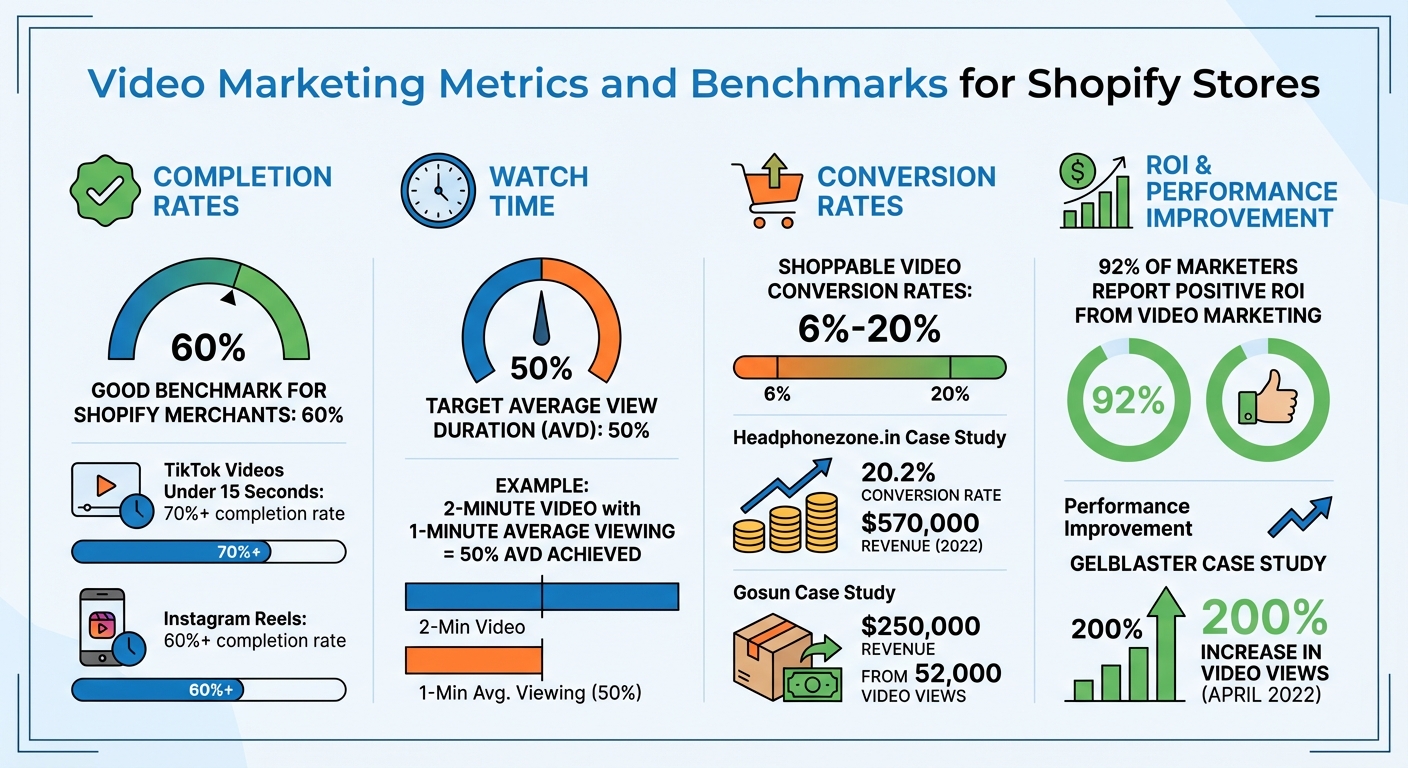
Video marketing analytics can transform how Shopify stores drive sales. By tracking metrics like views, watch time, and conversions, you can pinpoint what works and improve your strategy. For example, shoppable videos have been shown to achieve conversion rates of 6%–20% and drive significant revenue gains.
Key takeaways:
- Engagement metrics (completion rates, watch time, play rates) reveal how viewers interact with your videos.
- Conversion tracking connects video views to sales, helping you measure ROI effectively.
- Tools like Google Analytics 4 and Shopify's built-in analytics can simplify tracking.
- A/B testing thumbnails, video length, and CTAs can improve performance.
Start by setting up video analytics tools and analyzing viewer behavior to refine your content. With data, you can make smarter decisions and turn video views into revenue.
Shopify Analytics Tutorial: How to Track Conversions and Customer Behavior
Video Engagement Metrics for Shopify
Video Marketing Metrics and Benchmarks for Shopify Stores
When it comes to video content on Shopify, success isn't just about racking up views. Engagement metrics dig deeper, showing how well your videos capture attention and spark interest in your products. These insights help you separate the videos that truly connect with your audience from those that miss the mark.
View Counts and Completion Rates
View counts tell you how many people clicked "play", but completion rates reveal who stuck around until the end. For instance, a video with 1,000 views and a 90% completion rate is far more impactful than one with 10,000 views where most viewers drop off after just a few seconds. Why? Because completion rate - the percentage of viewers who watch your video from start to finish - is a key indicator of how well your content resonates.
For Shopify merchants, a completion rate of 60% is often seen as a good benchmark. Shorter formats tend to perform even better: TikTok videos under 15 seconds can hit completion rates of 70% or more, while successful Instagram Reels often hover above 60%. The trick is tailoring your video length to match your audience's attention span. While longer videos might work for explaining complex product features, quick highlights or teasers usually benefit from staying short and snappy.
Beyond completion rates, overall watch time offers another layer of insight into viewer engagement.
Watch Time and Average View Duration
Watch time measures the total minutes viewers spend watching your content, while Average View Duration (AVD) gives you the average time each viewer spends on your video by dividing total watch time by the number of views. These metrics are crucial because they reflect actual viewer engagement, not just fleeting clicks.
"Watch time acts as a powerful signal to platforms that your content is engaging and valuable".
For Shopify sellers, high watch time often leads to better product exposure and, ultimately, more conversions. A 50% AVD is a solid target for ecommerce videos. For example, if your 2-minute product demo averages 1 minute of viewing time, you've hit that 50% mark.
Real-world examples show how impactful these metrics can be. In 2022, Headphonezone.in generated $570,000 in revenue from video shoppers, achieving a conversion rate of 20.2%. Similarly, Gosun's CEO Peter Harten reported $250,000 in revenue from 52,000 on-site video views after refining their shoppable video strategy.
Once you’ve analyzed watch time, the next step is understanding how to get viewers to hit play and stay engaged.
Play Rates and Drop-off Points
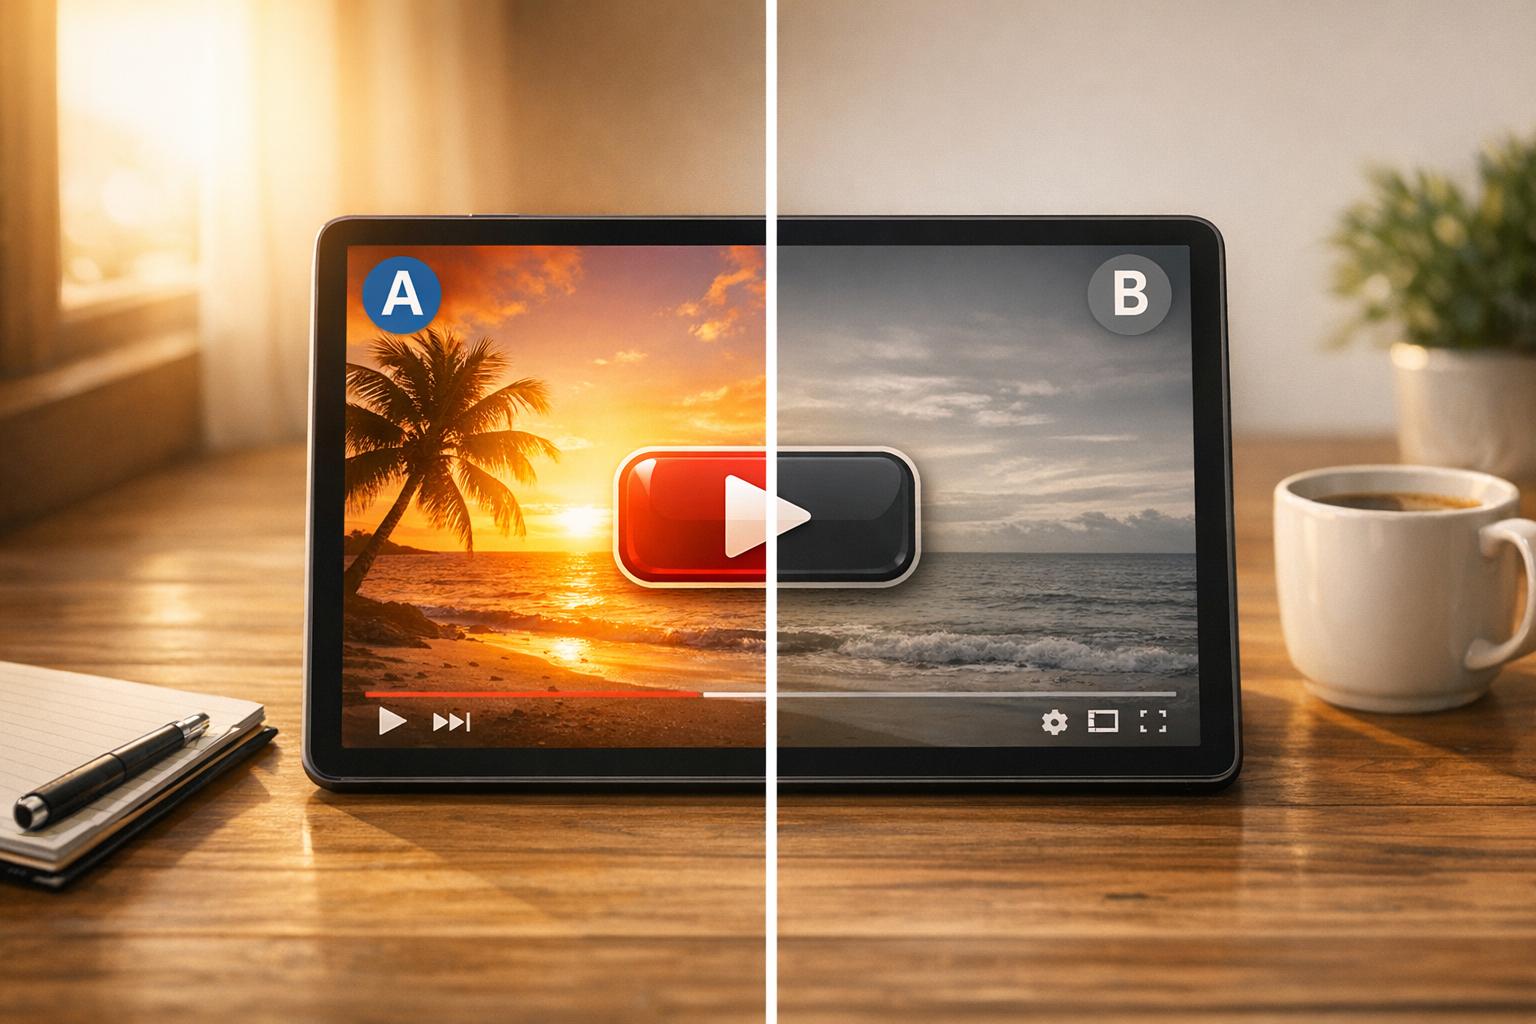
Play rate measures the percentage of page visitors who actually click "play" on your video. A low play rate can point to issues like an unappealing thumbnail, poor video placement, or a mismatch between the video and the surrounding content. Bright, high-contrast thumbnails often perform better, so it’s worth testing different designs to see what works.
Drop-off points, on the other hand, show you when viewers lose interest and stop watching. Retention graphs can help pinpoint these moments, offering clues on where to improve. For example, if viewers consistently leave around the 20-second mark, your opening hook might need more punch. Or, if they drop off just before a product demo, consider moving key benefits to the front of the video.
To keep viewers engaged, highlight your product’s main benefits within the first 15 seconds. Using "pattern interrupts" - changes in visuals or audio every 30–60 seconds - can also help re-capture attention. Even small adjustments can make a big difference. For instance, in April 2022, GelBlaster saw a 200% jump in video views after switching to a more interactive video platform.
Conversion Tracking from Video Views
Conversion tracking takes video engagement data a step further by linking viewer interactions to actual revenue. While engagement metrics show how many people watch your videos, conversion tracking reveals how those views translate into purchases. For Shopify merchants, the real value lies in connecting video views to dollars - tracking not only how many people watch a product demo but also how many proceed to checkout.
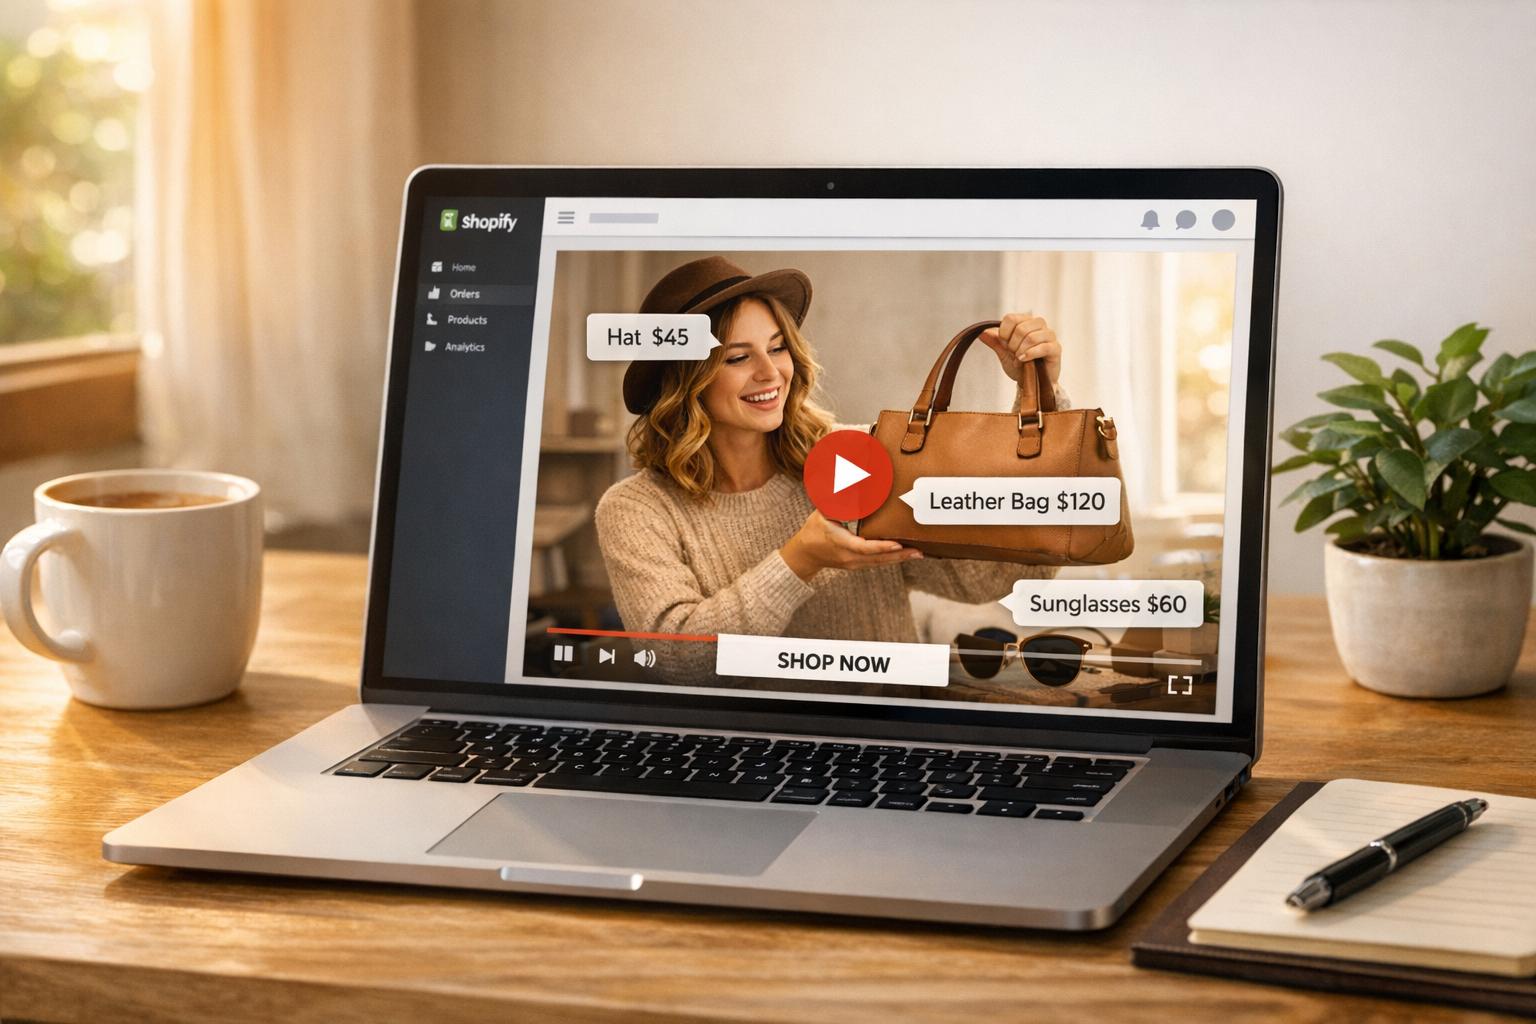
Click-Through Rates from Videos
Click-through rate (CTR) measures the percentage of viewers who act on calls-to-action (CTAs) embedded in your videos. These CTAs might include "Shop Now" buttons, annotation links, or email capture forms. To maximize impact, place CTAs during peak engagement moments when viewers are most interested. Use UTM parameters (e.g., utm_source=youtube&utm_campaign=product-launch) to track video-driven traffic and sales through Google Analytics 4. Even small tweaks - like testing a thumbnail with a person’s face versus a product-only image or replacing "Shop Now" with "Learn More" - can lead to noticeable improvements in CTR. Once viewers click, the next step is understanding how those clicks convert into sales.
Conversion Rates from Video Interactions
Conversion rate measures how video engagement leads to meaningful actions, like purchases or sign-ups. For Shopify store owners, it’s helpful to distinguish between two types of revenue:
- Direct sales: When shoppers add items to their cart and complete a purchase directly through the video player in the same session.
- Influenced sales: When viewers watch at least five seconds of a video and later make a purchase during the same session, but not directly from the video.
On Shopify, high-performing shoppable videos often achieve conversion rates ranging from 6% to over 20%. To better understand the customer journey, set up custom events in Google Analytics 4 - such as video_start, video_progress, and video_completion - to track the path from the first view to the final purchase. These insights form the foundation for calculating the ROI of your video campaigns.
Return on Investment (ROI) for Video Campaigns
To calculate ROI, divide the total revenue generated by the costs of video production and hosting. For Shopify stores, you can also calculate ROAS (Return on Ad Spend) by dividing total revenue by campaign spend.
In April 2022, GelBlaster saw a 200% increase in views after switching to a shoppable video platform, significantly boosting their conversion rate. Peter Lobanov, Growth Strategist at GelBlaster, shared:
"The ability to provide short format, shoppable videos is a game changer... it helped us tremendously with our CVR. The ability to buy the product after watching a few videos is genius and frictionless".
That same year, Gosun’s CEO Peter Harten used shoppable videos to generate $250,000 in revenue from 52,000 on-site video views, showing how conversion-focused video strategies can deliver measurable results.
To further improve ROI, Shopify's attribution models can help you understand how videos contribute at different points in the customer journey. The "Last non-direct click" model (Shopify's default) attributes credit to the final marketing interaction before a conversion. The "First click" model highlights channels that drive initial interest, while the "Linear" model evenly distributes credit across all touchpoints. Testing these models can reveal whether your videos are primarily closing sales or sparking early engagement.
sbb-itb-d9e5b3a
Setting Up Video Analytics Tools for Shopify
Once you've identified the key metrics that influence revenue, the next step is integrating the right tracking tools into your Shopify store. A proper setup ensures you’ll gather accurate data on how videos impact customer behavior and sales.
Integrating Google Analytics with Shopify Videos
To get started, connect Google Analytics 4 (GA4) to your Shopify store using the Google & YouTube sales channel app. This app is free to install and automatically tracks key ecommerce events like view_item, add_to_cart, and purchase whenever customers engage with your videos.
If you're tracking YouTube video engagement, enable Enhanced Measurement in GA4. Go to Admin > Data Streams, select your web stream, toggle "Enhanced measurement" to On, and click the settings gear icon to confirm that "Video engagement" is activated. This feature captures events like video_start, video_progress, and video_complete without needing extra coding. The video_progress event tracks viewer milestones at 10%, 25%, 50%, and 75% of the video.
To ensure GA4 detects your YouTube embeds, append ?enablejsapi=1 to the video URL in the iframe src attribute. Without this parameter, GA4 won’t recognize the video player. After completing the setup, use GA4's DebugView (found under Admin > Data display) to verify that events are being tracked in real-time as you interact with videos on your store.
Using Shopify Analytics for Video Insights
Shopify’s built-in analytics dashboard provides an easy way to see how video traffic translates into sales. Once you’ve installed the Google & YouTube app, video-related conversion data will appear in Analytics > Reports within your Shopify Admin. Shopify automatically logs events like begin_checkout and add_payment_info when customers move from video to purchase.
To differentiate traffic sources - like a YouTube ad versus an organic post - use UTM parameters in your video links. For example, a link for a product launch video could include utm_source=youtube&utm_medium=social&utm_campaign=product_launch. These parameters help Shopify's "Sessions by UTM Campaign" report group traffic by source. Additionally, the "Sessions by Referrer" report shows which video platforms drive the most visitors.
Keep in mind that if your store is password-protected, neither Google Analytics nor Shopify’s tracking tools will collect data. For more advanced video display options and tracking, consider exploring UWidget in the next section.
UWidget for YouTube Video Analytics
UWidget is a versatile tool for embedding YouTube content like galleries, carousels, sliders, sticky videos, shorts, playlists, and even subscribe cards. When paired with GA4’s Enhanced Measurement, UWidget tracks the same engagement events, such as video_start and video_complete, ensuring seamless data collection.
This app makes it easy to showcase multiple videos on product or landing pages while feeding engagement data back to GA4 and Shopify Analytics. Considering YouTube is the second-largest search engine after Google, monitoring the performance of your embedded videos is crucial for identifying which content drives the most conversions.
Improving Video Performance on Shopify
Once you've set up tracking and gathered baseline data, the next step is to transform those insights into actionable improvements. The focus should be on pinpointing where viewers lose interest and understanding why conversions aren't happening, then systematically testing solutions to address these issues.
Analyzing Data to Identify Problem Areas
Retention graphs are your go-to tool for spotting where viewers drop off. These visual aids can highlight pacing issues that might require editing. For example, if there's a sharp decline early on, it could mean your opening hook isn't grabbing attention.
Prioritize channels with high watch time and strong conversion rates. As Michael Keenan from Shopify explains:
"Views alone won't give you enough information to make significant improvements... watch time, or the estimated total minutes spent viewing your content, is more important than a raw view".
Instead of chasing raw view counts, focus your promotional efforts on sources that bring in engaged viewers. Use these insights to guide targeted A/B testing.
A/B Testing Video Content
Once you've identified problem areas, A/B testing becomes your best friend for refining video performance. This method allows you to test and optimize specific elements based on data. Key areas to test include:
- Thumbnails: Try expressive faces versus product-only images, and experiment with bright, contrasting colors to improve click-through rates.
- Video Length: Test short-form content (e.g., 15 seconds) against longer formats (e.g., 60 seconds or more) to see which holds attention better. Short videos often exceed 70% completion rates, while longer ones may sustain a 60–70% average view duration.
- CTAs (Call-to-Actions): Test variations in button text like "Shop Now" versus "Learn More", as well as button colors and timing. Use UTM parameters in your video links to track which versions drive the most conversions in Google Analytics.
- Opening Hooks: Compare approaches like leading with a question versus a direct statement, or starting with a product demo to see what improves retention.
| Element to Test | Testing Variables | Goal Metric |
|---|---|---|
| Thumbnails | Expressive faces vs. product shots; high contrast colors | Click-through rate (CTR) |
| Video Length | Short-form (15s) vs. long-form (60s+) | Completion rate / Average view duration |
| CTAs | "Shop Now" vs. "Learn More"; button color; timing | Conversion rate |
| Opening Hooks | Question vs. direct statement; product demo first | Audience retention rate |
Using Fractal Apps to Enhance Video Engagement
After optimizing your video content through A/B testing, you can take engagement a step further with Shopify apps designed to drive interaction. For example:
- ILikeThat: This app adds "like" buttons to your product pages, encouraging customers to engage and return to complete their purchases.
- CheckIt: A checkout progress bar that motivates customers to finish their transactions by visually showing how close they are to completing their purchase.
Both tools integrate seamlessly with your video analytics, ensuring that any improvements in engagement are accurately reflected in your Shopify reports. This creates a continuous feedback loop: track performance, identify drop-offs, optimize content, and use engagement tools to convert views into sales.
Conclusion
Your journey into video analytics brings together the essential insights needed to fuel growth. For Shopify stores, video marketing analytics reshapes how content is created and how customers engage with your brand. By removing the guesswork, analytics shows you exactly which videos connect with your audience and drive sales.
Here’s a powerful stat: 92% of marketers say video marketing delivers a positive ROI, while shoppable videos can achieve conversion rates as high as 20.2%. Case studies continue to show impressive revenue boosts when businesses optimize their video strategies.
To make a real impact, focus on revenue-driving metrics like completion rates, watch time, and conversion attribution. Use retention graphs to identify where viewers drop off, test different thumbnails and call-to-actions, and try tools like UWidget for YouTube analytics. Pair these with engagement boosters such as ILikeThat and CheckIt to enhance your strategy.
Start tracking your video performance today. Integrate Google Analytics, analyze retention graphs, and experiment with different video formats. Turn these insights into actionable steps to refine your strategy and generate measurable revenue growth.
FAQs
How can I use video analytics to increase sales on my Shopify store?
To boost sales using video analytics, concentrate on tracking metrics that reveal how your videos influence customer actions. For instance, audience retention helps pinpoint where viewers lose interest, allowing you to tweak your content to keep them watching. Keep an eye on click-through rates (CTR) to gauge how effectively your calls-to-action encourage interaction, and monitor conversion rates to see how many of those clicks turn into actual purchases.
Advanced analytics tools can also provide insights into video-driven orders, time spent on your site, and overall engagement levels. Regularly analyzing these metrics helps you identify which videos perform the best and fine-tune those that fall short. By continuously refining your video strategy based on these insights, you can drive more conversions and increase revenue for your Shopify store.
What video engagement metrics should I track to improve conversions on my Shopify store?
To increase conversions, pay close attention to metrics like watch time, click-through rate (CTR), audience retention, and video completion rate. These numbers give you a clear picture of how engaging your videos are, how well they’re driving traffic to your store, and whether viewers are following through on the actions you want them to take.
Digging into these metrics lets you see what’s clicking with your audience. From there, you can tweak your video strategy to keep viewers hooked and ultimately drive more conversions.
How can I use Google Analytics 4 to track video engagement on my Shopify store?
To monitor how visitors interact with videos on your Shopify store using Google Analytics 4 (GA4), you’ll first need to ensure your store is linked to a GA4 property. Start by enabling Enhanced Measurement in your GA4 settings. This feature automatically tracks basic video interactions, such as starts, progress milestones, and completions. Next, integrate the GA4 tracking code into your Shopify store - either directly or by using a tool like Google Tag Manager (GTM).
If you want to go beyond basic tracking, GTM allows you to set up custom triggers for specific video events, which is especially useful for videos hosted on platforms like YouTube or Vimeo. After configuring everything, test your setup by checking GA4’s real-time reports or using GTM’s preview mode. With this setup, you’ll gain valuable insights into how videos influence user engagement and conversions on your store.